
Access to all articles, new health classes, discounts in our store, and more!
The Relationship of Vitamin C Intake and the Total White Blood Cell Count
Published in Nutritional Perspectives, pp. 34-36, April 1978.
* * *
Introduction
A recent report1 suggested that the daily intake of vitamin C supplements yielded a reduction in the total white cell count. Quite apart from this report, another release2 indicated that, when one selects a symptomless and signfree group of individuals from a large population with an average state of health, the total white cell count shrinks to within a relatively narrow range.
The purpose of this report is to determine, in the light of these two previously reported observations, the relationship of vitamin C intake and the total white cell count in a reasonably large sample of presumably healthy individuals.
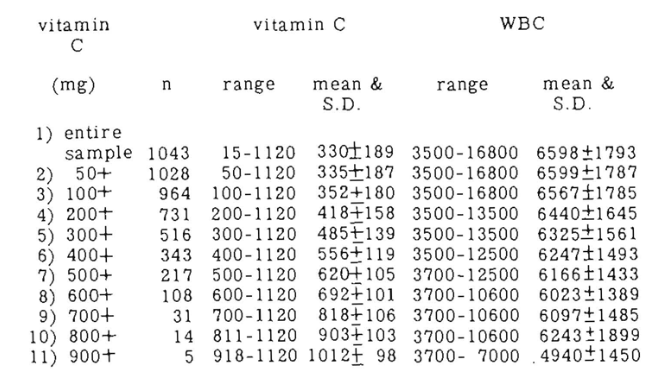
Table One (line 1) shows a sample of 1043 persons consuming a daily range of vitamin C from 15 to 1120 milligrams with a mean and standard deviation of 330 ± 139 (as judged from a food frequency questionnaire). In this group, the total white cell count spreads from 3500 to 16800 with a mean and standard deviation of 6598 ± 1793. Line 2 shows those of the subjects consuming 50+ milligrams of vitamin C per day. The sample has now been reduced from 1043 to 1028 with a vitamin C range of 50 to 1120 and a mean and standard deviation for the vitamin C of 335 ± 187.The WBC range is from 3500 to 16800 with a mean and standard deviation of 6599 ± 1787. As one proceeds downward on Table One, the daily vitamin C intake increases, the sample size decreases progressively, the mean vitamin C intake increases, and the standard deviation shrinks. It is interesting that, as one proceeds from line 1 to line 11, the mean WBC decreases progressively from 6598 to 4940 per cubic millimeter. Equally interesting is that the standard deviation shrinks from 1793 to 1450.
Table One–Relationship of reported daily vitamin E consumption (food frequency questionnaire) and WBC (white blood cell count) in a presumably healthy male and female sample
The statistical significance of the relationships just described are summarized in Table Two. It is evident that the mean values are significantly different from the total sample as one eliminates those subjects consuming the lesser amounts of vitamin C (Pm). It is also evident that the standard deviation shrinks significantly under these same conditions (PV).
Table Two–Statistical significance of the relationship of vitamin E intake (food frequency questionnaire) and white blood cell count

In an earlier report,2 the point was made that the ideal white cell count is approximately 5000-6000 cells per cubic millimeter. In this report, the evidence suggests that, as one selects from a large sample a group of individuals characterized by the consumption or relatively large amounts of vitamin C, the white cell count is in the range of 5000-6000 cells per cubic millimeter.
Summary
In an earlier report, evidence was presented from subjects without symptoms or signs of disease to indicate that the “ideal” total white cell count should be approximately 5000-6000 per cubic millimeter. The evidence derived from this study confirms this “ideal” range in a group of individuals characterized by a relatively large vitamin C intake.
References Cited:
- Robinson, A. B., Catchpool, J. R., and Pauling, L. “Decreased white blood cell count in people who supplement their diet with 1-ascorbic acid.” IRCS 3: 259, 1975.
- Cheraskin, E., Ringsdorf, W. M., Jr., Medford, F. H., and Hicks, B. S. “The ‘ideal’ total white cell count.” (in press)