
Access to all articles, new health classes, discounts in our store, and more!
The “Ideal” Daily Vitamin B1 Intake
Published in Journal of Oral Medicine, Vol. 33, No. 3, July-September 1978.
* * *
Introduction
According to the National Academy of Sciences-National Research Council1 the recommended dietary allowance for vitamin B1 has generally been related to energy intake. Additionally, the daily allowance has been predicated on assessments of the effects of dietary vitamin B1 on the genesis of clinical symptoms and signs, thiamin excretion in the urine, and erythrocyte transketolase activity. On this basis, the recommended daily thiamin intake for the female is held to be approximately 1.0 to 1.1 milligrams and for the adult male 1.2 to 1.4 milligrams.
Notwithstanding, there is no claim that the dosage of vitamin B1 recommended by the Food and Nutrition Board is intended as the “ideal” daily intake for the maintenance of optimal general health.
Earlier studies have attempted to develop a true “ideal” daily consumption of refined carbohydrates,2 vitamin A,3 vitamin B3,4 and vitamin C5 on the hypothesis that relatively symptomless and sign-free persons are healthier than those with clinical symptoms and signs. Therefore, the intake of such groups might well provide a basis for designating the “ideal” daily thiamin consumption.
Method of Investigation
One thousand nine dentists and their wives were evaluated in terms of daily reported thiamin consumption as judged from a food frequency questionnaire (Dietronics F-1 questionnaire). Clinical state was graded by the Cornell Medical Index Health Questionnaire (CMI). The CMI is a self-administered text consisting of 195 questions. Each question is answered by circling the word “yes” and “no.” The questions are phrased so that the affirmative answers indicate pathology (signs and symptoms). The clinical findings in this report are the total number of affirmative CMI responses (CMI score).
Results
Table One shows (line 1) the daily vitamin B1 consumption of the entire group of doctors and their wives. In this sample of 1009, the CMI score ranged from 0 to 125 with a mean and one standard deviation of 15.8 ± 12.4. The daily reported thiamin intake ranged from 0.3 to 19.2 milligrams with a mean and standard deviation of 5.08 ± 5.16. This is approximately three to fourfold the amount designated as the RDA. The reason for this is likely that many of these subjects supplement their diet daily with multivitamin preparations containing thiamin. Parenthetic mention should be made that both the American Medical Association6 and the American Dental Association7 have indicated that the type of doctor interested in his own health has above average health.
Table One–Relationship of reported daily Vitamin Bx consumption (food frequency questionnaire) and reported total clinical findings (Cornell Medical Index Health Questionnaire) in a presumably healthy male and female sample
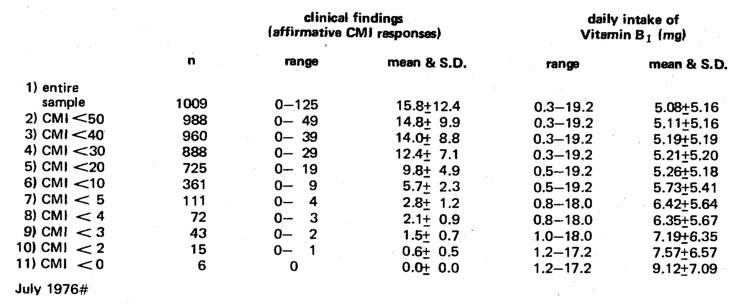
Since the thiamin intake of this group exceeded RDA standards, it would generally be regarded as “ideal” or “optimal.” However, proceeding through Table One, it becomes obvious that progressively fewer symptoms and signs are associated with ever-increasing intake of thiamin. For example, deleting all subjects with 50+ symptoms and signs (line 2) leaves a sample size of 988, a mean and standard deviation CMI score of 14.8 ± 9.9 and a thiamin mean and standard deviation of 5.11 ± 5.16. Exclusion of all subjects with 40+ symptoms and signs (line 3) nets a sample with a daily thiamin intake of 5.19 ± 5.19. Proceeding through the eleven lines of this table, the daily thiamin intake slowly rises as the number of allowable clinical symptoms and signs (CMI score) is reduced.
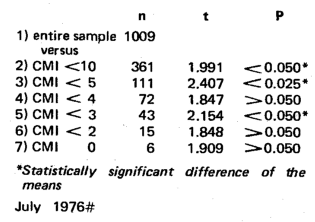
Table Two indicates that there are statistically significant differences in the daily thiamin intake when one compares the consumption of the entire sample to those with <10, <5, <4, and <3 clinical findings.
Table Two–statistical significance of the relationship of Vitamin Bx (food frequency questionnaire) and reported clinical findings (CMI)
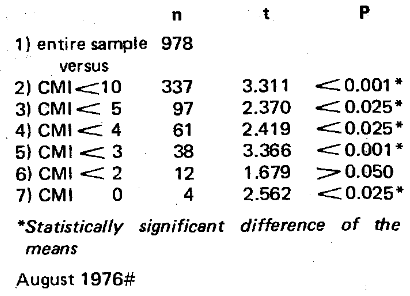
As a check the analysis was repeated utilizing the data derived from a seven-day dietary survey. Line 1 (Table Three) shows the entire sample with a CMI range of 0-125, a mean and standard deviation of 16.1 ± 12.2, a vitamin B1 range of 0.19-4.80 milligrams and a mean and standard deviation of 0.99 ± 0.40. As one proceeds downward from line 1 to line 11, the daily thiamin intake increases about 50 per cent (0.99 to 1.50). Table Four shows that there are statistically significant differences between the entire sample (line 1) and CMI <10 (line 2), <5 (line 3), <4 (line 4), <3 (line 5), and 0 (line 7).
Table Three–Relationship of reported daily Vitamin B1 consumption (seven-day dietary survey) and reported total clinical findings (Cornell Medical Index Health Questionnaire) in a presumably healthy male and female sample
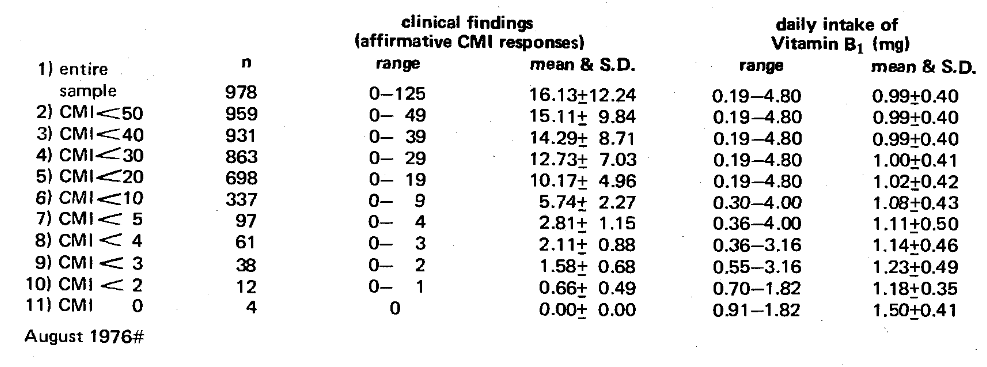
Table Four–Statistical significance of the relationship of Vitamin B1 (seven-day dietary survey) and reported clinical findings (CMI)
Attention should be directed to the differences in the thiamin values in Tables One versus Three. This is due to the fact that the food frequency technique (Table One) includes vitamin supplementation; the seven-day dietary survey (Table Three) does not.
Summary
This approach indicates that the healthier the sample, the greater the thiamin intake. Under the conditions of this experiment, approximately 9 milligrams of thiamin may be designated as the “ideal” daily allowance. This is approximately eightfold the RDA of the 1 to 1.4 milligrams for adult males and females.
It is recognized that the “ideal” as a theoretic end point is nonexistent since there is biochemical individuality and because the art of measuring leaves much to be desired. Nonetheless, the technique utilized here provides a mechanism and a goal not previously considered.
References Cited:
- Food and Nutrition Board, United States National Research Council-National Academy of Sciences–Recommended dietary allowances: National Academy of Sciences, Washington, D.C., 1974.
- Cheraskin, E., Ringsdorf, W.M., Jr., and Hicks, B.S. “The sweet sickness syndrome: I. The refined carbohydrate consumption.” Int. Acad. Prev. Med. 1:107-120, 1974.
- Cheraskin, E., Ringsdorf, W.M., Jr., and Medford, F.H. “The ‘ideal’ daily vitamin A intake.” J. Vit. Nutr. Res. 46:11-13, 1976.
- Cheraskin, E., Ringsdorf, W.M., Jr., and Medford, F.H. “The ‘ideal’ daily niacin intake.” J. Vit. Nutr. Res. 46:58-60, 1976.
- Cheraskin, E., Ringsdorf, W.M., Jr., and Medford, F.H. “The ‘ideal’ daily vitamin C intake.” (submitted for publication)
- “You may be sicker than you think.” J.A.M.A. 181:27, 1962.
- “ADA health screening program for dentists.” A.D.A. 79:235, 1969.