
Access to all articles, new health classes, discounts in our store, and more!
The Health of the Dentists and His Wife: Present Findings in a Predictive Health Program
Published in the Journal, Southern California Dental Association, Vol. XXXVII, No. 9, September 1969.
* * *
This is the companion article to one published in the July 1969 issue by the same authors. A group of dentists and their wives are presently involved in a predictive medicine program to help them pursue a longer, healthier life. The limited evidence suggests that simple dietary alterations can yield beneficial effects.
Introduction
A previous publication1 outlined the philosophy and the mechanics of a predictive health program presently being conducted on a group of dentists and their wives. This report is designed for a threefold purpose. First, to review the strategy and tactics of such a project. Second, to relate some of the initial findings of the group. Finally, to analyze the changes in the population following a series of health education lectures.
Methods of Investigation
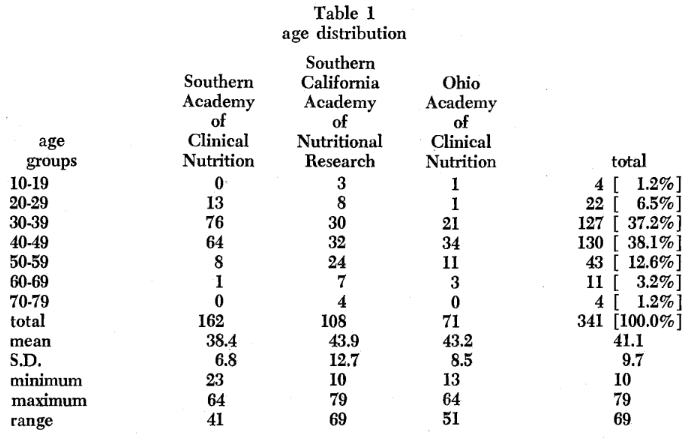
At this writing, 341 individuals are participating in the screening program. Table 1 lists the age distribution for the entire sample and also the age distribution of the dentists and their wives in the three separate groups. Parenthetic mention should be made that five children are included ranging from 10 to 20 years of age. It is noteworthy that the mean age is 41.1 years and the majority of subjects within the 30 to 59 year age category. The Southern California Academy of Nutritional Research and the Ohio Academy of Clinical Nutrition are in the first year of study. Hence, only initial findings can be reported. The Southern Academy of Clinical Nutrition has been in operation since late in 1965. Hence, changes in the group can be related before and after a series of lectures designed to show: [1] the dietary patterns for the group, and [2] measures which could be instituted to improve the dietary patterns.
Initial Findings
Mention was made1 that man can be viewed as a lamellated sphere and, therefore, can be studied at different levels [Figure 1]. In healthy man [Figure 2], there are no signs of disease peripherally. There are also no symptoms, performance is optimal, biochemical, hormonal, and enzymic balance prevail. Finally, the relevant core state is characterized by an adequate diet. Illness begins at the center with poor genetics and other identifiable and unidentifiable factors. One core problem which lends itself readily to alteration is poor diet [Figure 3]. With advancing time, changes occur at the enzyme level, followed by hormonal and then biochemical imbalance. Eventually, performance suffers, symptoms arise and signs appear.

Figure 1.
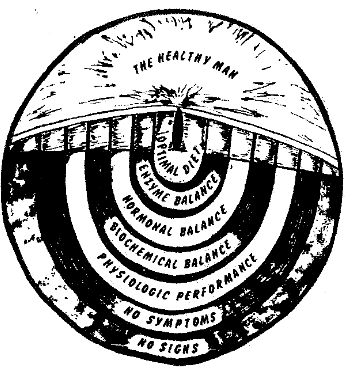
Figure 2.
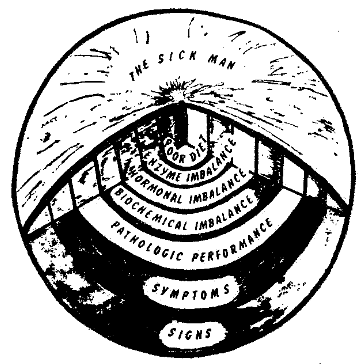
Figure 3.
An attempt will be made here to describe briefly some of the findings at some of the levels in the sphere.
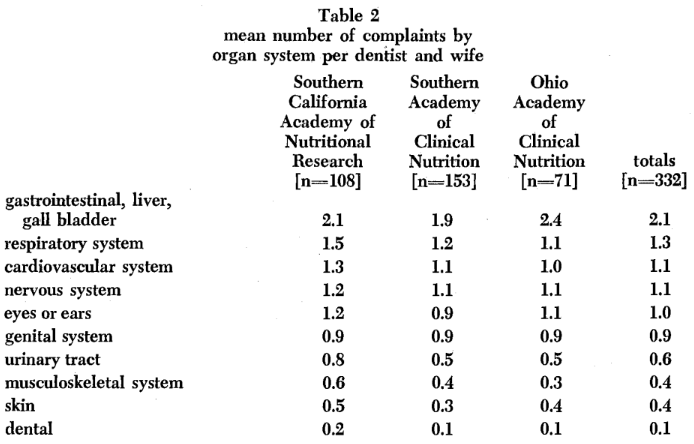
Clinical symptoms and signs: It should be recalled that each participant completed the Cornell Medical Index Health Questionnaire. The data derived from this form can be viewed in three different ways: (1) specific reported diseases (e.g., hemorrhoids, hypertension), (2) number of reported complaints per organ system (e.g., cardiovascular symptoms and signs), and (3) total number of reported findings (e.g., number of affirmative answers). In the interest of brevity, only the mean number of complaints per organ system is presented [Table 2]. It is clear that the most common reported findings relate to the gastrointestinal tract with 2.1 complaints per person. Parenthetic mention should be made that gastrointestinal symptoms and signs rated first in all of the three groups. Table 2 also summarizes mean number of findings for the major systems.
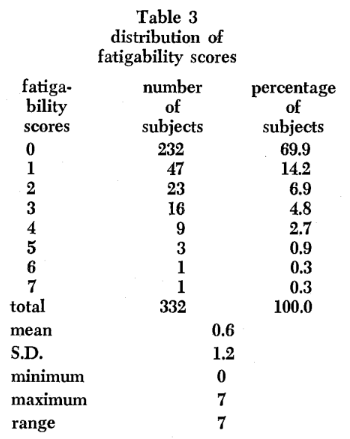
Physiologic performance: The point has already been made that, before the advent of signs of disease (objective findings), there is already a diminished performance. This can be measured in a number of ways ranging from crude estimates (reported fatigability) to sophisticated quantitative tools (e.g., exercise devices). For purposes of this discussion, attention is directed to the frequency of fatigability complaints. Table 3 shows that the subjects reported from zero to seven complaints representative of fatigability with a mean of 0.6 per person.
Dietary habits: Mention was made earlier that each participant completed two dietary records. One consisted of a seven-day dietary form which was subsequently analyzed by Doctor Michael Walsh, Nutritionist, (P. O. Box 3217 Olympic Station, Beverly Hills, California). The other dietary record consisted of completing a simple form (dietronic dietary analysis) which was then interpreted by Hanson Research Corporation, (6170 Sepulveda Boulevard, Van Nuys, California 91408). For purposes of this discussion, a few of the results of the seven-day diet records are considered.
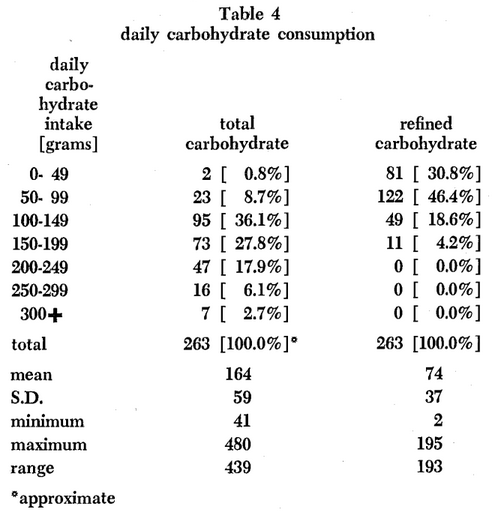
As illustrative of the analysis of the major foodstuffs, Table 4 summarizes the daily carbohydrate consumption for the group. Of particular interest to the dental practitioner should be the fact that the dentists and their wives in this group consume from as little as 2 to a high of 195 grams of refined carbohydrates per day.
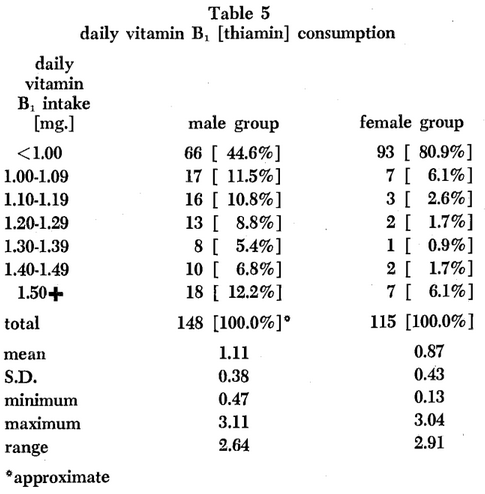
To represent the dietary vitamin patterns, Table 5 summarizes the daily vitamin B1 (thiamin) intake. According to the Food and Nutrition Board of the National Research Council,2 males and females should consume approximately 1.4 and 1.0 mgm. thiamin daily. Table 5 shows that only about one in five individuals are consuming adequate amounts of vitamin B1.
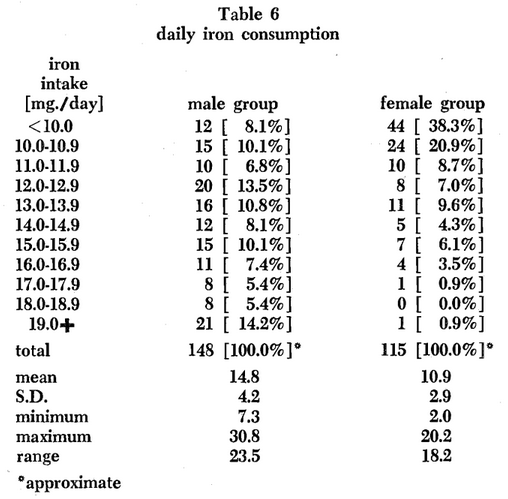
To reflect dietary mineral patterns, Table 6 outlines the iron consumption. According to the Food and Nutrition Board of the National Research Council,2 the male and female should consume 10 and 18 mgm. iron per day, respectively. On this basis, about 90 per cent of the males and only one per cent of the females are consuming adequate amounts of iron in the daily diet.
Since each person had before him his own results, it was possible to relate himself to the group and to observe any deficits.
The Interim
Following the initial analysis, the group was given a series of lectures describing their own dietary patterns, the optimal diet, and the methods for attaining optimal dietary habits. For example, discussions were held regarding adequate and inadequate meals.3 Tables 7-9 show satisfactory and unsatisfactory breakfasts, lunches and dinners. Also included are the nutrient differences.
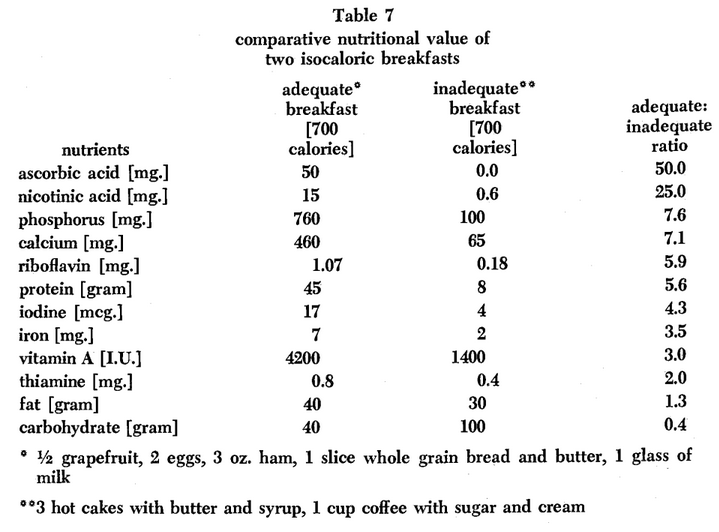
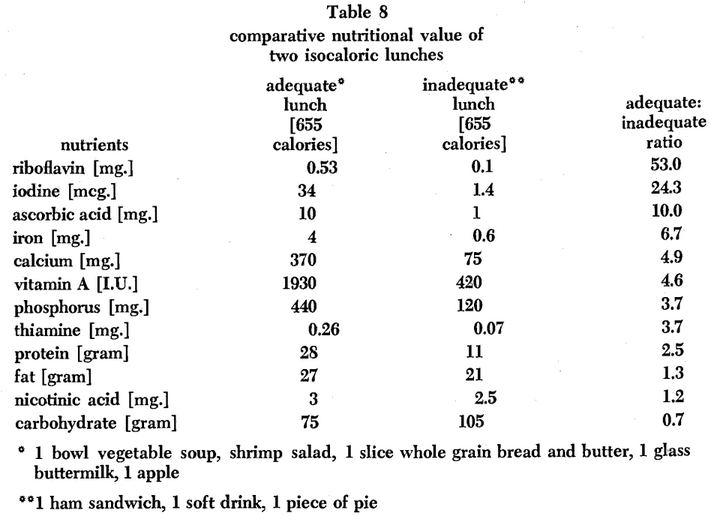
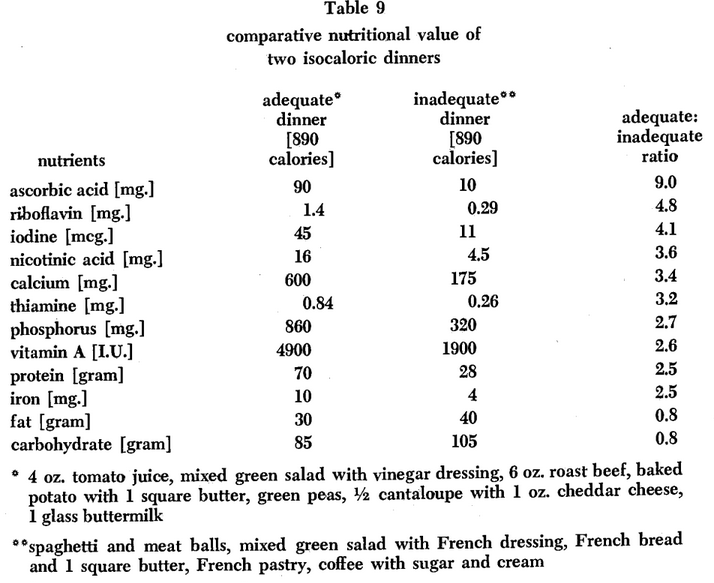
Thus, each subject could relate his own eating habits to the optimal diet and learn, by this group technique, his own dietary adequacies and shortcomings.
The Follow-Up Findings
Approximately eighteen months after the initial testing procedure was completed, the group was re-examined by the same techniques previously described. Brief mention will be made here of some of the results.
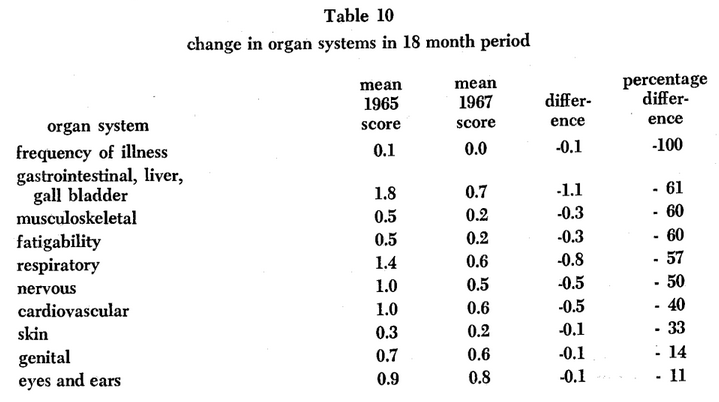
Symptoms and Signs: Table 10 shows the mean complaints per organ system initially and at the follow-up study. It will be noted that there was a mean of 1.8 complaints per person for the gastrointestinal system at the first examination. The mean approximately eighteen months later was 0.7 findings per person. Thus, there was a reduction of 1.1 complaints. It is noteworthy that, as far as can be determined, this 61 per cent reduction was very likely the result of the lectures on diet and nutrition. Table 10 also shows the reduction in findings in other systems. Hence, viewing these individuals peripherally [Figures 1-3], there is marked improvement. Apropos to performance, it is noteworthy that initially there was 0.1 findings per person regarding frequency of illness and this was reduced to 0.0 [a 100 per cent reduction]. Also, Table 10 shows that fatigability findings were reduced 60 per cent.
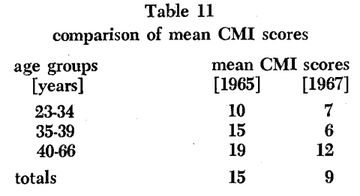
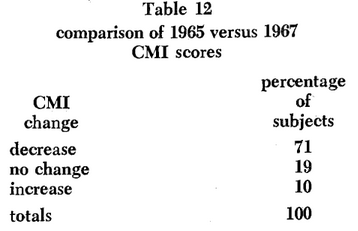
Mention was made earlier that another way of viewing the Cornell Medical Index Health Questionnaire [CMI] is simply to sum the number of positive responses suggesting disease. An analysis of the findings in 1965 and 1967 are included [Table 11]. It will be noted that, in every age category, there is a substantial reduction in the number of complaints irrespective of organ systems. For the entire group, there is actually a decrease of 40 per cent. Phrased another way [Table 12], 71 per cent of the subjects had fewer complaints in 1967 versus 1965. Nineteen per cent of the group was unchanged. Finally, 10 per cent demonstrated an increase.
Performance: One of the parameters recorded initially and at the recall session was the standard three limb lead electrocardiogram. Thirteen different electrocardiographic parameters were measured in each lead twice at different times to insure accuracy. The values were obtained under magnification to identify small differences. The reproducibility of this technique has been reported.4
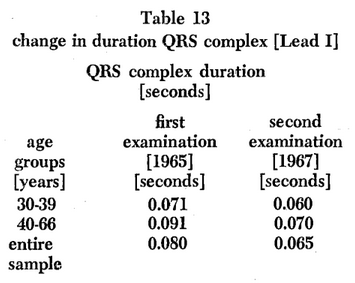
For purposes of this discussion only the QRS complex in Lead I will be considered. The QRS complex [expressed in seconds] represents ventricular depolarization. Ordinarily, with advancing time [age], the QRS complex slowly widens.5 When it is approximately 0.12 seconds or more, a diagnosis of heart block is suggested. Table 13 shows the mean QRS complex values for the entire group in 1965 and 1967. One would anticipate either no change or slight prolongation with the advance of 18 months in age. The evidence shows, however, there is actually a mean shortening from 0.080 to 0.065 seconds [a decrease of approximately 20 per cent]. In other words, for purposes of this discussion, the evidence indicates that, on a mean basis, the group is younger at heart! Additionally, Table 13 shows that older subjects [40-66 years] in 1967 had a mean QRS complex similar to that in the younger group [30-39 years] in 1965 [0.070 versus 0.071 seconds]. Here again is some evidence of the effect of dietotherapy upon health status. These observations are in keeping with other published reports.6
Summary
A group of dentists and their wives are presently involved in a predictive medicine program designed to anticipate rather than to simply identify disease. The initial plan of the program is to determine the effect of group dietary instructions upon health state as judged by signs and symptoms, performance, biochemical, hormonal, and enzymic state. The limited evidence presented here suggests that simple dietary alterations can yield beneficial effects at all echelons.
References Cited:
- Cheraskin, E. and Ringsdorf, W. M., Jr. “The Health of the dentist and his wife: a predictive health program.” J. South. California Dent. Assn. 37: #7, 271-276, July 1969.
- Food and Nutrition Board-National Research Council. Recommended dietary allowances. Seventh revised edition. 1968. Publication #1694. Washington, D.C., National Academy of Sciences.
- Cheraskin, E., Ringsdorf, W. M., Jr. and Clark, J. W. Diet and disease. 1968. Emmaus, Pennsylvania, Rodale Books, Inc. pp. 324-347.
- Cheraskin, E., Ringsdorf, W. M., Jr. and Setyaadmadja, A. T. S. H. “The use of a microscope for electrocardiographic measurement.” Exper. Med. & Surg. 23: #4, 369-374, December 1965.
- Lepeschkin, E. Modern electrocardiography. Volume One. 1951. Baltimore, The Williams and Wilkins Company.
- Cheraskin, E., Ringsdorf, W. M., Jr., Setyaadmadja, A. T. S. H. and Barrett, R. A. “Effect of carbohydrate supplements upon the height of the T wave in Lead I.” Angiology 19: #4, 225-231, April 1968.