
Access to all articles, new health classes, discounts in our store, and more!
The Effect of a Low-Refined-Carbohydrate High Protein Diet Upon Nonfasting Erythrocyte Count
With W.M. Ringsdorf, Jr., DMD, E. Cheraskin, MD, DMD and C.F. Hollis, BS. Reprinted from the British Journal of Clinical Practice. Volume 16, Number 2.
* * *
Introduction
Previons reports have attempted to analyze the effect of a low-refined-carbohydrate highprotein diet upon a number of biochemical processes including nonfasting blood sugar (1), calcinm (2), phosphorns (3), calciumphosphorus relationships (4), and cholesterol (5). A second series of reports have dealt with the relationship of physiologic processes (blood pressure (6)) and this same diet. Attention will now be directed to a consideration of the low-refined-carbohydrate highprotein diet and hematologic processes.
There is quite a volume of pnblished literature regarding the relationship of diet to the erythrocyte count. In this report, an attempt will be made to review the literature and to correlate the findings of the various experimental groups. Special emphasis is placed upon the not-too well-publicized effect of a low-refined-carbohydrate high-protein diet upon the red cell count.
Review of the Literature
Although not an exhaustive search of the literature, this report covers the authoritative works concerning diet and the erythrocyte count.
Effect of Diet upon the Erythrocyte Count
It is noteworthy that, of the areas pertinent to this study, principal attention has been directed to protein in the diet rather than to dietary carbohydrate.
Low-Protein Diet: Orten and Orten (7, 8) have demonstrated that dietary proteins are quantitatively and qualitatively necessary for physiologic hemopoiesis in the rat. Weech and his coworkers (9) have shown that dogs maintained on a low-protein regime exhibit a progressive fall in the red cell count. Alt (10) reported that a uryptophan-deficient diet yields a lowered erythrocyte count. Doles (11) eliminated red meat from the diet of two healthy dogs. He concluded that red meat is essential for red cell production at all periods of life. However, he noted that this need is increased particularly in older animals. Doles further commented that there was little difference in the response to deficiency of red meat between the dog and human.
High-Protein Diet: Robscheit-Robbins and Whipple (I2) carried out extensive studies on the effect of dietary proteins upon dogs made anemic and hypoproteinemic by a combination of bleeding and a low-protein intake. The authors found that egg products favored the production of plasma protein whereas fresh beef muscle contributed to hemoglobin production. Smith (1) reported that liver-fed trout show higher red cell counts than those fed naturally. Takeda (4) did not find a flesh diet to be of particular advantage in the maintenance of a high red cell count after strenuous exercise in dogs.
Adequate Diet: Jones et al (15), in monkey studies, and Smith (16), from observations in the dog, reported on the importance of an adequate diet for laboratory animals. Smith (16) found that an adequate diet fed to laboratory raised dogs yields a red cell count appreciably higher than usually quoted as being normal.
Miscellaneous Diets: Orten and his coworkers (I7) reported that the hematologic abnormalities which occur in rats fed a mineral-deficient diet are due chiefly, if not entirely to a lack of calcium and/or iron. Loewy and associates (18) noted in the dog that a high-fat diet brings about an increased rate of red blood cell destruction.
Several investigators (19, 20 21, 22) have compared the effects of improper wartime diets upon the hematologic picture with that observed under pre- and postwar conditions. In every case there was reported a reduction in the number of red cells as a result of wartime diets. Stix and Kiser (23) have attempted to correlate nutritional status of school children dietarily and per erythrocyte counts with little success.
Erythrocyte Count Criteria
Erythrocyte Count Homeostasis. Among the many factors which alter the red blood cell count are age, sex, altitude of residence, and muscular activity. Wintrobe (24) reported the erythrocyte number to be high at birth, to decrease in three months, rise at puberty, and subsequently decline with advancing age. Other investigators (25, 26, 27) have studied the decrease in the erythrocyte count with old age. Miller (25) explains the phenomenon on the basis of low grade infections, nephrosclerosis, and decreased bone marrow cellularity. A possible fourth factor studied by Walters (28) is decreased muscular activity.
The altitude of residence is known to parallel the erythrocyte count. Andresen (29) and Lurie (30) conducted studies on the blood picture of healthy subjects residing at over 5,000 feet above sea level. All authorities recognize a difference in the red cell count between the sexes (26, 27, 31-33). There is, however, disagreement as to the cause or causes for the sexual differences. Wintrobe (24) reports no parallelism with the normal menstrual period but a positive correlation with puberty. Newman (27) and Fowler (26) found the sexual difference to persist into old age. Vahlquist (32) reports that this difference, though not due to menstrual blood loss, is of endocrine origin. Schnitter (34) found that the erythrocyte count among males and females undergoing physical education training was the same within experimental error and that this apparent difference is due to decreased muscular activity in our culture.
Among those factors investigated which do not seem to relate to red blood cell count are climate, temperature and season (24, 35), race (36), hemoglobin content of blood (37), smoking (38), working conditions (39), and occasional blood donation (40).
Erythrocyte Count Normality: A cross sectional representation of the results (24, 32, 33, 36, 41-47) o£ 3,310 adult male subjects shows the lowest values to be approximately 3.87 million per cu. mm. and an upper Limit of 6.70 million. The range of the means was found to be 4.23 to 5.50. The mean of the reported means was found to be 5.07 million per cu. Mm.
A review of the literature for the normal red cell count of adult, American females (24, 32, 33, 37, 41-44, 48, 49) (4,247 subjects) showed a low limit of 3.50 and an upper limit of 5.61. The range of the means was 3.88 to 4.93 and the calculated mean of the means was reported to be 4.62 million per cn. mm.
Method of Investigation
Four hundred and ninety-three ambulatory Causasian patients were studied with regard to the circulating erythrocyte count, Table l shows the age and sex distribution. Generally, the sample is divided almost equally between the two sexes. The greatest number of patients, using two decade intervals, are between 50 and 69 years of age, though the subjects ranged from the second to the ninth decades. Of the sample of 493 subjects, the age was not determined in five. Therefore, in subgroup analyses, only 488 individuals are included. The mean ages for the male and female group proved to be 51.78 and 50.6l years respectively.
Each patient presented in the clinic between 9:00 and 12:00 A.M. after a customary breakfast meal. A venous sample was drawn and a non fasting erythrocyte count was performed immediately. The scores obtained will hereafter be referred to as based on a regular diet.
TABLE 1
| Age and sex distribution | ||||||
| male | female | total | ||||
| age group | no. | % | no. | % | no. | % |
| 10-29
30-49 50-69 70-89 undetermined |
10
89 120 22 0 — 24 1 |
2.02
18.06 24.34 4.47 0.00 — 48.89 |
16
83 124 24 5 — 252 |
3.24
16.84 25.15 4.87 1.01 — 51.11 |
26
172 244 46 5 — 493 |
5.26
34.90 49.49 9.34 1.01 — 100.00 |
The patient was then given dietary instructions to follow for the next three days. Meat, fish, fowl, vegetables, whole grain (as breads, cereals, vegetables), eggs, nuts, butter, and cream were allowed in quantities desired by the patient. Weak tea, decaffeinated coffee, natural condiments, and water were allowed ad libitum. Specific instructions were given not to eat sugar and refined sugar products, white flour products, fruit and fruit juices, milk and milk products (except butter and cream), preserved meats, and alcohol. The only dietary supplement given for the three day period was one tablet of 75 mg. of vitamin C (rose hips) daily. Hereafter, this regime will be referred to as a basic or preparatory diet (preparatory to blood tests). In order to be as certain as possible that the instructions were followed, the patient was given a form on which all foods eaten were to be recorded during the three-day period.
Finally, the patient was instructed to return on the fourth day between 9:00 and 12:00 A.M. after breakfast based on the above recommendations. At this second visit, a venous sample was again drawn and another erythrocyte count performed immediately.
Results
The findings will be considered in two ways: () general characteristics, and (2) subgroup analyses. General Characteristics
The mean initial red cell count for the 493 patients proved to be 4,75 with a standard deviation of 0.35. This can be interpreted to mean that approximately two-thirds of the patients, specifically 68 per cent, ranged from 4.40 to 5.10. Three days after subsisting on the preparatory diet, the mean count decreased to 4.55 with a standard deviation of the difference of 0.27. The coefficient of correlation for the entire group was found to be -0.434 with a P < 001. Thus, the evidence seems reasonable that, under this dietary program, the erythrocyte count changes significantly.
Subgroup Analyses
For reasons considered elsewhere, the data have been rearranged in tens of: (a) sex, and (b) age and sex.
Sex Analysis: The mean initial red cell count for the 241 male patients proved to be 4.90 with a standard deviation of 0.29, This can be interpreted to mean that approximately two-thirds of the patients, actually 68 per cent, ranged from 4,610,000 10 5,190,000 per cu. mm. Three days after subsisting on the preparatory diet, the mean count decreased to 4,890,000 and the standard deviation decreased slightly. The coefficient of correlation for the entire male group was found to be -0.310 with a P < 001. Thus, the evidence seems reasonable that, under this dietary program, the erythrocyte count in the male changes significantly.
TABLE 2
| Nonfasting erybrocyte count changes following a three-day low-refined-carbohydrate high-protein diet | |||||
| regular diet | difference after three-day lo-refined-carbohydrate high-protein diet | ||||
| age and sex groups | mean | standard deviation | mean | standard deviation | P |
| 10- 29 years
male(10) * female (16) 30-49 years male (89) female (83) 50-69 years male (120) female (124) 70- 89 years male (22) female (24) |
4.93 4.66
4.93 1.55
4.88 4.64
4.86 4.60 |
0.18 0.21
0.33 0.32
0.28 0. 39
0.23 0.28 |
-0.01 0.01
-0.01 0.04
-0.02 -0.12
0.03 0. 02 |
0.22 0. 20
0.24 0.26
0.31 0.29
0.21 0.16 |
> 0.100 < 0.025
< 0.001 < 0.001
> 0.050 < 0.001
< 0.010 < 0.010 |
* number of subjects in parentheses
The mean initial red cell count for the 252 female patients proved to be 4.61 with a standard deviation of 0.34. This means that 68 per cent of the values ranged from 4,270,000 to 4,950,000 per cu. mm. Three days after subsisting on the diet, the mean count decreased to 4,600,000 and the standard deviation decreased considerably. The coefficient of correlation for the entire female group was found to be 0.591 with a P <.001. Thus, the evidence seems reasonable that, under this dietary program, the erythrocyte count in the female changes significantly.
Age and Sex Analysis: Attention is directed to the study of the erythrocyte count initially and three days later in terms of age and sex. Such an analysis is shown in Table 2. It can be observed that there were statistically significant changes in the erythrocyte count in all age groups. More detailed examination of Table 2 shows the most significant changes in the 30-49 year age category. This is in parallel with the findings previously reported with regard to blood sugar (1), serum calcium (2), serum phosphorus (3), calcium-phosphorus relationships (+), serum cholesterol (5), and blood pressure (6).
Discussion
The data thus far presented will be considered in the light of: (1) general characteristics, and (2) subgroup analyses.
General Characteristics.
The evidence from these 493 subjects indicates that there is a tendency for the nonfasting erythrocyte count to change under the conditions of a high-protein low-refined-carbohydrate diet. This is underscored by the change in the mean (4,750,000 to 4,550,000), the shrinking of the standard deviation (350,000 1to 270,000), and the significant correlation coefficient (r = 0.434 and P < 001).
The evidence from the 241 male subjects indicates that there is a tendency for the nonfasting erythrocyte count to approach 5,000,000 per cu. mum. This is graphically emphasized in Figure 1, The data from the 252 female subjects suggests that there is a tendency for the nonfasting erythrocyte count to approach 4,500,000 per cu. Mm. This is pictorially demonstrated in Figure 2.
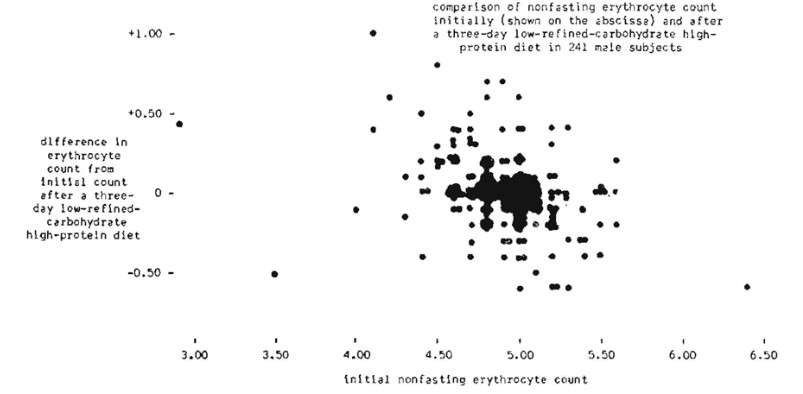
Fig. 1
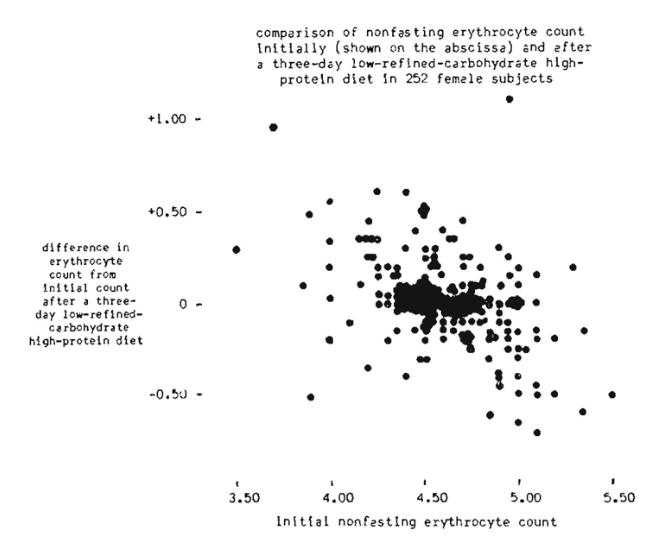
Fig. 2
It is, of course, hazardous to draw conclusions as to what the normal nonfasting erythrocyte count should be from such data. However, the evidence at least suggests that 5,000,000 and 4,500,000 might well be the ideal physiologic scores for the male and female respectively.
The most interesting observation from this three-day dietary regime is that counts above 5.0 and 4.5 decreased while those below 5.0 and 4.5 rose. This point has only been reported once before in the literature (50). These observations make it feasible to speculate that: (l) protein and carbohydrate (other than refined) contribute measurably to erythrocyte homeostasis, and (2) the delicate hormonal regulation of the circulating red cell count functions more efficiently in a low-refined-carbohydrate high-protein environment.
Summary
- Nonfasting erythrocyte counts of 493 patients were made initially (during a period of regular diet) and three days after a high-protein and low-refined-carbohydrate regime.
- Evidence is presented to show that, under this dietary course, the nonfasting erythrocyte count tends to seek a more narrow physiologic range than is currently recognized.
- It would appear, at least presumptively, that 5,000,000 and 4,500,000 erythrocytes per cu. mm. may well be the ideal (physiologic) nonfasting values for the male and female respectively
References Cited
- Page, M E., Ringsdorf, W. M., Jr. and Cheraskin,E. The effect of a low refined-carbohydrate high protein diet upon nonfasting blood sugar. Odontologisk Revy 12:1, 1-24, 1961.
- Page, M. E., Ringsdorf, W. M., Jr. and Cheraskin, E. The effect of a low refined carbohydrate high-protein diet upon nonfasting blood calcium Ann. Biochem. and Exper Med, (pending publication)
- Page, M. E., Ringsdorf, W. M., Jr., Cheraskin, E. nd Hollis, C. F. The effect of a low-refined carbohydrate high-protein diet upon non-fasting blood phosphors. Texas Dental Journal 79:11, 7-14, November 1961.
- Page, M. E., Ringsdort, W. M., Jr. and Cheraskin, E. The effect of a low-refined -carbohydrate high-protein diet upon nonfasting blood calcium. phosphorus relationships, Jour. Western Soc of Periodontology (pending publication)
- Page, M. E., Ringsdort, w. M., [r. and Cheraskin, E. The effect of a low-refined-carbohydrate high-protein diet upon nonfasting blood cholesterol, (to be published).
- Page, M. E, Ringsdorf, W. M., Jr., Cheraskin, E and Hollis, C F, The effect of a low-refined carbohydrate high-protein diet upon nonfasting blood pressure. (to be published).
- Orten, A. V. and Orten, J. M. A study of hemoglobin formation following the administration of certain amino acids to rats fed a diet low in protein. Jour Nutrit, 30. 2, 137-142, August 1945.
- Onten, J. M. and Orten, A. V, The comparative value of certain dietary proteins for hemopoiesis in the rat Jour Ntrit. 31:6, 765-775, June 19466.
- Weech, A. A., Wollstein, M. and Goettsch, E Nutritional edema in dog development of deficits in erythrocytes and hemoglobin on diet dtf1C1tnl m pro/em. Jom. Clin. fnvest. 16; 3, 719.728, September 1 9!7.
- Alt, H. L. The relation of growth and nutrition to the reticulocyte level in the young rat. Jour Nutit. 16: 6, 597.602, December 1938.
- Doles, H. M. Effect of diet on red cell and hemoglobin formation, blood nitrogen and albuminuria. South Med. Jour. 33:12, 1298-1301, December 1940.
- Robscheit-Robbins, F. S. and Whipple, G, H Dietary effects on anemia plus hypoproteinemia in dogs. Jour. Esper. Med. 89: 3, 339-358, March 1, 1949.
- Smith, C. A comparative study of the total red counts of wild and lier-fed trout. Proc. Soc Exper. Med. and Biol. 27. 1, 670.673, April 1930.
- Takeda, E. Influence of muscular exercise on the blood figure of experimental animals kept on different kinds of diet. Jap. Jour. Exper. Med. 13: 4, 511-520, August 10, 1935
- Jones, E. S., McCall, K. B, Eivehjem, C. A. and Clark, P. F. Effect of diet on hemoglobin, erythrocyle, and leukocyte content in Rhesus monkey (Macaca mullata} Blood 2: 2, 154.163, March 1947.
- Smith, S. G, Evidence that physiologic normal hemoglobin values for adult dog blood is 18 grams per 100 cc. Amer. Jour. Physiol. 142: 3, 476-482, October 1944.
- Orten. J. M., Smith, A, H. and Mendel, L. B Relation of calcium and of iron to erythrocyte and hemoglobin content of blood of rats confuming mineral deficient ration [our, Nuttit 2: 4, 373.385, October 1936.
- Loewy. A, Freeman, W., Marchello, A, and Johnon, V, Increased erythrocyte destruction on a high fat diet. Amer. Jour. Physiol, 138. 2, 230 235, January 1943.
- Singer, E, and Canter, L. Determination of plasma protein, number of red corpuscles, and hemoglobin as methods of nutritional survey. Chinese Med. Jour. 64. 5.6, 41-144, May-June 1946
- De Vries, S. I. Changes in hematologic standard vales following deficient diet, study of 100 cases. Nedel. Tidschr, v. Geneesk. 90: 42, 1434. 1438, October 19, 1946.
- Lange, H. and Palmer, H. Normal erythrocyte values, especially in wartimes. Acta Med. Scandinav, 127. 1-16, 1947.
- Josepbson, B., Dablberg, CG and Totterman, G Effect of nutrition upon blood count and chemical composition of blood. Scandinav. Jou, Clin and Lab. Invest. 43, 237.9241, 1952.
- Stix, R. K. and Kiser, C. V. Relation of “correct” weight and blood findings to physicians estimates of nutrition of school children. Jour Pediat. 5: 6, 763-770, December 1934.
- Wintrobe, M. M. Clinical hematology. Third edition. 1952. Philadelphia, Lea and Febiger p. 94.
- Miler, I. Normal hematologic standards in the aged, Jour. Lab. aad Cin. Med. 24. 11, 1172. 1i76, August 1939