Access to all articles, new health classes, discounts in our store, and more!
The Effect of A Low-Refined-Carbohydrate High Protein Diet Upon Nonfasting Blood Phosphorus
Published in the Texas Dental Journal, pp. 7-14, November 1961.
* * *
Introduction
In earlier reports, the findings obtained from a study of the effect of a low-refined-carbohydrate high-protein diet upon nonfasting blood sugar1 and calcium2 were analyzed. This paper will attempt to present the results derived from an analysis of the effects of a low-refined-carbohydrate high-protein diet upon phosphorus metabolism. Investigation in this sphere is incomplete and quite fragmentary. A subsequent report will describe the effects of this same dietary regime upon nonfasting calcium-phosphorus relationships.3
Review of the Literature
Effect of Diet Upon Blood Phosphorus: It is generally recognized that there exists a definite relationship between the diet and blood phosphorus. A number of dietary variations will be considered in this section.
Effect of High Carbohydrate Intake Upon Blood Phosphorus: Bergeim4 added various common carbohydrates to the diets of rachitic albino rats to make up 25-50 percent of such diets. Phosphorus absorption was studied under these conditions. Starch, glucose, fructose, and maltose in amounts of 25 percent do not increase phosphorus absorption. At 25 percent, dextrin shows little effect but at 50 percent a distinct increase in absorption. Lactose at 25 percent leads to pronounced increases in amounts of phosphorus absorbed. In a rabbit experiment, Dupre and Semenoff5 show a fall in serum phosphorus when rabbits are fed cabbage and a rise when a carbohydrate (bran and oats) diet is employed. The average values increase from 3.0 mg. (cabbage feeding) to 7.5 mg. percent (bran and oats feeding) In contrast, Steinman6 has demonstrated a decrease in blood inorganic phosphorus and in the phosphate content of rats’ teeth when they are fed simple sugars (glucose, fructose, and sucrose). Lactose, however, does not produce this effect.
The conclusion to be drawn from the majority of the published reports of human studies is that with a high-refined (sugar, glucose, dextrose) carbohydrate intake, either orally or intravenously, there is a statistically significant reduction in the serum inorganic phosphorus level which lasts over a period of 3.5 hours.7-14 Farquharson and Tibbets’7 work shows that, in all subjects on a high carbohydrate intake, there is an early fall in serum phosphorus levels. The initial serum phosphorus concentration seems to have no influence on the magnitude of the change nor does there appear to be any definite relation between the extent of the decrease in serum phosphorus and the change in the blood sugar level.
The consensus, then, is that with increased carbohydrate intake there is a reduction in blood phosphorus. This is opposite to the dietary carbohydrate-blood calcium pattern.7,8.14-16
Effect of Protein Intake Upon Blood Phosphors: In studies by Kunerth17 and Pittman,18 subjects on low-protein and medium-protein consumption are compared. The authors find that the subjects on a low-protein diet are in a negative calcium and phosphorus balance. In contrast, those persons on a medium protein regime show improved calcium-phosphorus relationship, but phosphorus is still in negative balance.
It would, therefore, appear that protein intake and blood phosphorus are directly related. This direct relationship is in contrast to the observations concerning dietary carbohydrate and blood phosphorus but is in agreement with the published literature on dietary carbohydrate and blood calcium.2 Whereas increased glucose intake yields reduction in blood phosphorus, added protein consumption parallels increased serum phosphorus.
Effect of Phosphorus Intake Upon Blood Phosphorus: Cavins19 found that a diet deficient in phosphorus caused, in rats, a decrease in serum phosphorus from 7-8.5 mg. percent to 2-3 mg. percent.
McKay and coworkers,20 in a study of college women, observed that the phosphorus intake is significantly related to retention. Farquharson et al7 determined that phosphate ingestion produces a rise in serum inorganic phosphorus without any appreciable change in serum calcium. Irving also shares this opinion.21
Miscellaneous Dietary Alterations: A study made by Schnelling22 for four weeks upon dogs on a vitamin B deficient diet revealed no noteworthy change in the blood inorganic phosphorus concentration. Fasting of rachitic rats produces a rise in serum inorganic phosphorus to as much as 16 mg. percent and a healing of rickets.19 It is suggested that loss of weight from body protein degradation releases phosphorus. According to an investigation by Mull and Bill23 of inorganic phosphorus determinations on 205 normal, nonpregnant women, phosphorus varies with age. The average for the group under 30 years of age is 3.8 mg. percent while the group over 30 years has an average of 3.3 mg. percent.
Blood Phosphorus Criteria
Phosphorus Homeostasis: Cori,24 in experiments with insulin-injected rabbits, found that after twenty minutes the phosphates were noticeably diminished, reached their lowest point after 45 minutes, and then slowly returned to the original level.
Studies by Gamhasi and Matasozzo25 demonstrated that the inorganic phosphorus level in normal fasted persons or patients with mild illnesses, decreased during the first hour in 9 percent of the cases if doses of insulin (30 to 70 units) were administered. The decrease was in most cases proportional to the insulin dose and the degree of hypoglycemia. It was noted by Izzo,26 in a study of 15 patients, that blood glucose level and serum inorganic phosphate level appeared to be related in a reciprocal manner. The degree of correlation did not appear to be dependent upon age, duration, or type of diabetes mellitus.
Thus, the consensus is that increased utilization of glucose is accompanied by lower levels of inorganic blood phosphorus and vice versa. This relationship was also apparent from the reported studies of high carbohydrate intake (orally and intravenously and blood phosphorus.6-8,9-14
Fasting versus Nonfasting Blood Phosphorus: Laskowki27 has indicated by studies, conducted on laying hens, that fasting over a period of four to six days stops egg-laying for a few days and reduces phosphorus to the level of the nonlaying hen. The blood plasma of laying hens contain about 3.5 times as much phosphorus as that of nonlaying hens. The phosphorus content of the plasma of fasting hens is not affected even six hours after feeding large amounts of phosphorus.
After a fast of about twelve hours, Jaffe aud Bodansky28 report that practically all serum inorganic phosphate values normally fall between 2.5 mg. percent aud 4.0 mg. percent for adults, 4.5 mg percent to 5.5 mg. percent for children, and 5.5 mg. percent to 6.5 mg. percent in infants. A study conducted by Sunderman29 on a 54-year-old male, who had voluntarily undergone a 45-day fast, showed on the forty-fifth day of fasting an inorganic phosphorus level of 3.4 mg. percent.
Phosphorus Normality: The blood inorganic phosphorus in many small animals is slightly higher than found in human adults. The values range from 4-8 mg. percent and, thus, more closely approximate the inorganic phosphorus levels in human infants.30-33
In human studies made by various groups, the inorganic phosphorus values range from .5 mg. percent to 4.7 mg. percent34-38 with a mean of approximately 3.6 percent.
The consensus is that the inorganic phosphorus rises steadily after birth until the maximum value is reached at four to six months (4.5 mg. percent to 6.0 mg. percent). From the first year through the twelfth, the value remains nearly constant. A drop is observed in late childhood. After adulthood is reached, the value does not vary significantly with age.33.39-42
The level of inorganic phosphorus is influenced somewhat by sex as well as age The inorganic phosphorus of the blood has a tendency to be lower in females than in males in practically all age groups.40.43-46
Method of Investigation
Four hundred and ninety-three ambulatory Caucasian patients were studied with regard to phosphorus metabolism as measured by serum inorganic phosphorus (Benedict method47).
Table 1 shows the age and sex distribution. Generally the sample is divided almost equally between the two sexes. The greatest number of patients, using two decade intervals, are between 50 and 69 years of age, though the subjects ranged from the second to the ninth decades. Of the sample of 493 subjects, the age was not determined in five. Therefore, in subgroup analyses, 488 subjects are used. The mean ages for the male and female group proved to be 51.78 and 50.61 years respectively.
Table 1–age and sex distribution
| age group | male | female | total | |||
| no. | % | no. | % | no. | % | |
| 10-29
30-49 50-69 70-89 undetermined |
10
89 120 22 0 —— 241 |
2.02
18.06 24.34 4.47 0.00 —— 48.89 |
16
83 124 24 5 —— 252 |
3.24
16.84 25.15 4.87 1.01 —— 51.11 |
26
172 244 46 5 —— 493 |
5.26
34.90 49.49 9.34 1.01 —— 100.00 |
Each patient presented in the clinic between 9:00 and 12.00 A.M. after a customary breakfast meal. A venous sample was drawn and nonfasting serum phosphorus was performed immediately. The scores obtained will hereafter be referred to as based on a regular diet.
The patient was then given dietary instructions to follow for the next three days. Meat, fish, fowl, vegetables, whole grain (as breads, cereals, vegetables), eggs, nuts, and butter were allowed in quantities desired by the patient. Weak tea, decaffeinated coffee, natural condiments, and water were allowed ad libitum. Specific instructions were given not to eat sugar and refined sugar products, white flour products, fruit and fruit juices, milk and milk products (except butter), preserved meats, hydrogenated fats and alcohol. The only dietary supplement given for the three-day period was one tablet of 75 mg. of vitamin C (from rose hips) daily. Hereafter, this regime will be referred to as a basic or preparatory diet (preparatory to blood tests). In order to be as certain as possible that the instructions were followed, the patient was given a form on which all foods eaten were to be recorded during the three-day period.
Finally, the patient was instructed to return on the fourth day between 9.00 and 12:00 A.M. after breakfast based on the above recommendations. At this second visit, a venous sample was again drawn and a serum phosphorus determination performed immediately.
Results
The findings will be considered in two ways: (1) general characteristics, and (2) subgroup analyses.
General Characteristics
The mean initial blood phosphorus for the 493 patients proved to.be 3.24 mg. percent with a standard deviation of 0.46 mg. percent. This can be interpreted to mean that approximately two-thirds of the patients, specifically 68 per cent, ranged from 2.78 to 3.70 mg. percent. This is quite in accord with postprandial determinations described earlier in this report.34-38 Three days after subsisting on the preparatory diet, the mean blood phosphorus rose to 3.43 mg. percent with a difference of 0.19 and a standard deviation of the difference of 0.46 mg. percent.
The scores obtained for the 493 patients initially and after the dietary regime are pictorially reported in Figure 1. Shown along the abscissa are the initial blood phosphorus findings. The difference between the initial scores and the findings three days later are charted on the ordinate. The largest darkened area represents the collection of dots signifying the group of patients with initial and final nonfasting levels of approximately 3.7 mg. percent. It is very clear from this graph (and particularly from Figure 2 showing the mean values) that there is a definite line of regression. The coefficient of correlation for the entire group was found to be -0.615 with a P<.001. Thus, the evidence seems reasonable that, under this dietary program, patients with blood phosphorus above 3.7 mg. percent tend to be reduced to or about 3.7 mg. percent. Also, it appears that those scores below 3.7 mg. percent tend to rise to or about 3.7 mg. percent.
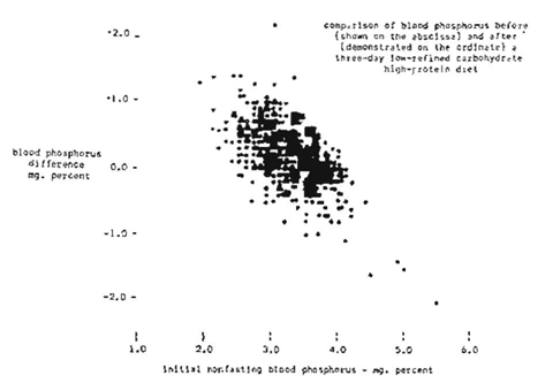
Figure 1
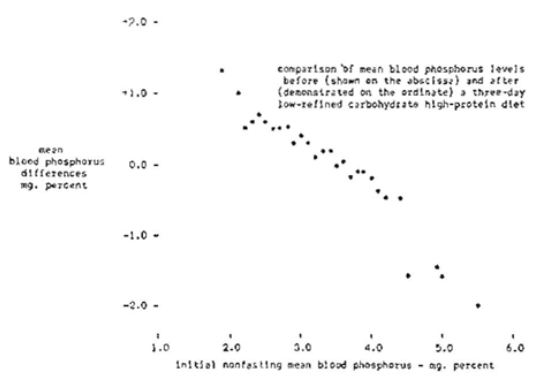
Figure 2
The question arose as to whether blood phosphorus changes would significantly differ if the low-refined-carbohydrate high-protein diet were to be continued for longer than three days. To answer this question, 24 subjects were studied initially (regular diet), three days later (basic diet), and several days to weeks later maintaining the same basic dietary regime. Values of 3.20 ± 0.41, 3.52 ± 0.38, and 3.40 ± 0.43 were found respectively. Thus, it appears that blood phosphorus levels change most significantly during the first three-day diet period.
Subgroup Analyses
Attention will be directed to a study of the nonfasting blood phosphorus levels initially and three days later in terms of age and sex, Such an analysis is shown in Table 2. It can be observed that there were statistically significant changes in the blood phosphorus level in all age groups except the youngest (10-29 years) More detailed examination of Table 2 shows that in all of the age groups the tendency is for blood phosphorus to rise toward 3.7 mg. percent.
Discussion
The data thus far presented will be considered in the light of: (1) general characteristics, (2) subgroup analyses, and (3) the method of laboratory testing.
Table 2–blood phosphorus changes following a three-day low-refined-carbohydrate high-protein diet (Benedict method47)
| age groups | regular diet | difference after three-day low-refined-carbohydrate high-protein diet | |||
| mean | standard deviation | mean | standard deviation | P | |
| 10-29 years
male (10)* female (16) 30-49 years male (89) female (83) 50-69 years male (120) female (124) 70-89 years male (22) female (24) |
3.41 3.32
3.13 3.28 3.15 3.37 3.07 3.26 |
0.46 0.34
0.46 0.38 0.53 0.42 0.40 0.34 |
0.15 0.27
0.19 0.20 0.16 0.23 0.02 0.17 |
0.26 0.36
0.44 0.42
0.51 0.50 0.32 0.40 |
>0.100 >0.050
<0.001 <0.001 <0.001 <0.001 <0.050 <0.050 |
* number of subjects in parentheses
General Characteristics
The evidence from these 493 subjects indicates that there is a tendency for the nonfasting blood phosphorus to approach 3.7 mg. percent (as measured by the Benedict method47) under the conditions of a high-protein low-refined-carbohydrate diet. This is underscored by the rise in the mean, by the very clearcut line of regression, and the significant negative correlation.
It is, of course, hazardous to draw conclusions as to what physiologic nonfasting blood calcium should be from these types of data. However, the evidence at least suggests that 3.7 mg. percent might well be the ideal physiologic score.
The most interesting observation from this three-day dietary regime is that blood phosphorus levels below 3.7 mg. percent increased just as those above this value decreased. These results, together with those mentioned above, make it feasible to speculate that: (1) protein and carbohydrate (other than refined) contribute measurably to blood phosphorus homeostasis, and (2) the delicate hormonal regulation of blood phosphorus functions more efficiently in a low-refined-carbohydrate high-protein environment. Similar findings were observed with regard to the effect of a low-refined carbohydrate high-protein diet upon blood sugar previously reported.
Subgroup Analyses
A study of the age and sex differences are summarized in Table 2. It can be observed that the changes in the youngest age group were not significant, This is precisely the finding previously reported with regard to blood sugar. Also, Table 2 shows that the most significant differences occurred in the 30-49 and the 50-69 year age groups. Significant, but less so, are the findings in the oldest age category. One can speculate that the imbalance in very elderly people may be so great that dietary change alone is incapable of righting the phosphorus picture. Whether this is the entire explanation or only part of it cannot be concluded from this particular study.
Method of Laboratory Testing
Attention should be directed to the fact that blood phosphorus in the 493 subjects was determined by the Benedict method.47 It was thought important to establish whether similar patterns would be derived by studying blood phosphorus by other techniques. Accordingly, 25 subjects were investigated as previously described except that the serum phosphorus levels were done colorimetrically.48-49
Figure 3 shows that serum phosphorus values above and below approximately 3.7 mg. percent following the three-day diet decreased and increased respectively to or about 3.7 mg. percent. Specifically, at the start of this study, the serum phosphorus was found to be 3.09 ± 0.66 mg. percent. Three days later the mean increased to 3.40 and the standard deviation shrunk to 0.50. The statistical significance of the change is shown by a coefficient of correlation of -0.655 and a P of <.005.
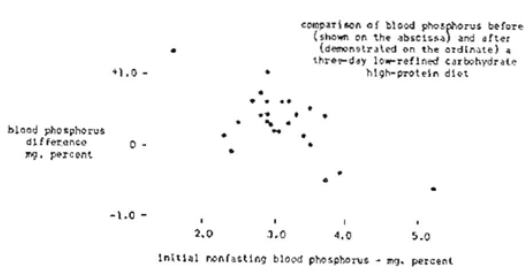
Figure 3
lt is noteworthy that the changes in serum phosphorus under this dietary regime are similar to the blood sugar and glucose findings1 and serum calcium determinations2 previously reported. In both instances, the values decreased to within a relatively narrow range indicating the possibility that the physiologic ranges for blood sugar, glucose, calcium, and phosphorus may be more limited than currently held.
Summary
- Nonfasting blood phosphorus analyses of 493 patients were made initially during a period of regular diet) and three days after a high-protein and low-refined carbohydrate regime.
- Evidence is presented to show that, under this dietary regime, the nonfasting blood phosphorus tends to seek a more narrow physiologic range than is currently recognized.
- From the data presented in this report, it appears that the changes which occur with this dietary regime become more significant with increasing age up to a point
- It would appear, at least presumptively, that 3.7 mg. percent may well be the ideal (physiologic) nonfasting blood phosphorus level.
- Because of the delicate interplay of calcium and phosphorus metabolism, attention will be directed in a subsequent report to the relationship of a high-protein low-refined-carbohydrate diet and calcium-phosphorus product.3
This study was made possible in part by a grant from The American Society of Anthropometric Medicine and Nutrition.
References Cited: