
Access to all articles, new health classes, discounts in our store, and more!
Stomatology and the Total Organism: A Study in Carbohydrate Metabolism
Report to the V International Congress of Stomatology of the A.S.I., Rome, October 13-16, 1966. Published in Rivista Italiana Di Stomatologia, Vol. XXI, No. 7, 1966.
* * *
Introduction
By act, if not by word, modern stomatology is still wedded to the theory that oral disease is essentially of local causation. In contrast, the ecologic hypothesis set forth in this report recognizes that, whether one maintains health or succumbs to disease is a function of the interplay of environmental stressors and the capacity of the organism to meet with success (via host resistance) or failure (through host susceptibility) the many and diverse physical, chemical and microbial environmental challenges (Fig. 1). The utility of this formula is evident by simply substituting poliomyelitis for health or disease. The environmental challenge in this affliction is obvious invasion by the poliomyelitis virus. However, this is not the entire genesis of the disease. There is the well-established clinical observation that most individuals are invaded by the microorganism yet do not develop the disease. This can only be explained by granting that host factors are operative which make the viral challenge innocuous. Further, history underlines the fact that our greatest biologic advances have stemmed from altering host state rather than the environment. Apropos to poliomyelitis, it is theoretically possible to eradicate the virus. More practically, the technique is one of altering the organism so that it can live with the microbial threat. This is the concept of vaccination. Parenthetic mention should be made that the single major biologic advance in stomatology has also been one of modifying host state (namely fluoridation) rather than changing the oral environment.
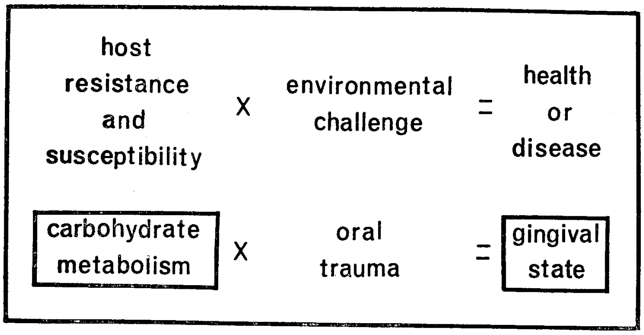
Fig. 1
Like any other theory, this equation must be tested. This will be attempted (Fig. 1) through a study of gingival state (as one oral parameter) versus blood glucose (as one barometer of host state). Specifically, an attempt will be made within these pages to analyze carbohydrate metabolism as a diagnostic instrument, as a therapeutic tool, and a prognostic device.
Method of Investigation
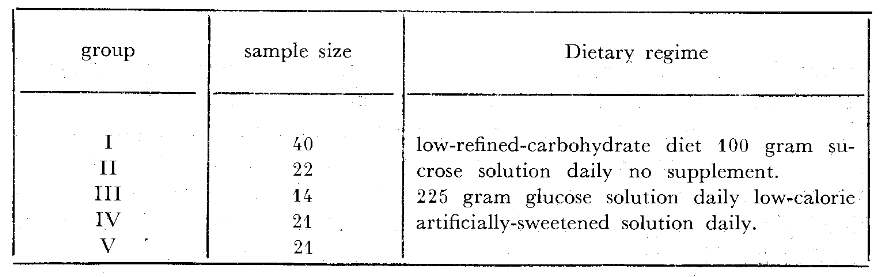
One hundred and eighteen presumably healthy third-year dental students shared in this study. The gingiva of each of the incisor teeth was graded on a four-point scale ranging from zero to three (Table 1) on a Monday and Friday of the same week at approximately 10:15 A.M. The mean or average gingival score was derived for each subject and expressed to the first decimal. At each of these two visits, venous blood glucose was determined by the Somogyi-Nelson method.12 The 118 students were then randomly categorized in five subgroups (Table 2). Forty of the individuals (Group I) were simply instructed to consume a relatively low-refined-carbohydrate diet during the experimental three-day period. Twenty-two (Group II) received per orum 50 grams of chemically pure sucrose at 7:45 A.M. and 1:15 P.M. (a total of 100 grams per day) during the test time. Fourteen persons (Group III) were given nothing. Twenty-one students (Group IV) ingested 75 grams of glucose in solution at 7:45 A.M., 9:45 A.M. and 1:15 P.M. (225 grams daily) during the Monday to Friday interval. The remaining twenty-one participants (Group V) were supplied with a low-calorie artificially-sweetened beverage indistinguishable from the glucose supplement. Neither the single examiner nor the students was aware of the nature of the supplements nor the recorded findings during the course of the experiment.
Table 1–Gingival state evaluation.
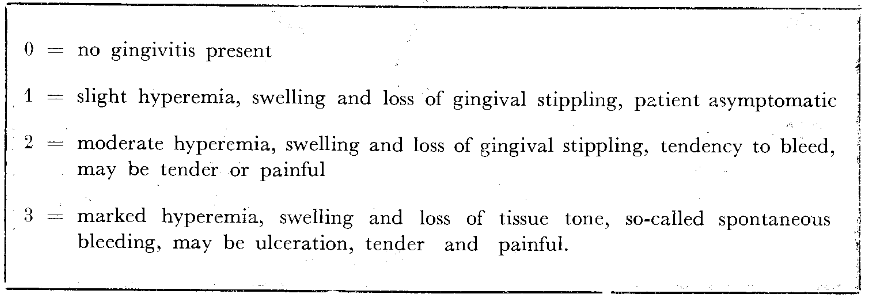
Table 2–Experimental groups.
Results
Diagnostic significance prevails when two variables correlate significantly even if neither is the cause of the other. To test the ecologic formula, the mean gingival scores were plotted against blood glucose (Fig. 2). Shown one the ordinate are the mean clinical scores expressed in two decimals; described on the abscissa are the biochemical findings listed as blood glucose groups. The first and most obvious point is that the lowest mean gingival value (a score of 0.51) parallels the 67 readings in the 80 to 84 mg. per cent blood glucose group. Secondly, and supported by other investigations,3-13 is the fact that progressively higher blood glucose scores are associated with progressively higher mean gingival values. Thus, the 85 to 89 mg. per cent blood glucose category (including 23 readings) has a mean clinical score of 0.54; the 90+ group an average of 0.61. Finally, and supported by still other studies,14-15 is the fact that there is also a rise in gingival scores with relatively low blood glucose concentrations. Thus, the blood glucose groups below 80 mg. per cent show mean gingival scores of 0.61. In other words, within the limits of these observations and supported by other studies, there is indeed a relationship (a parabolic one) and therefore diagnostic utility in carbohydrate metabolism as it relates to gingival status.
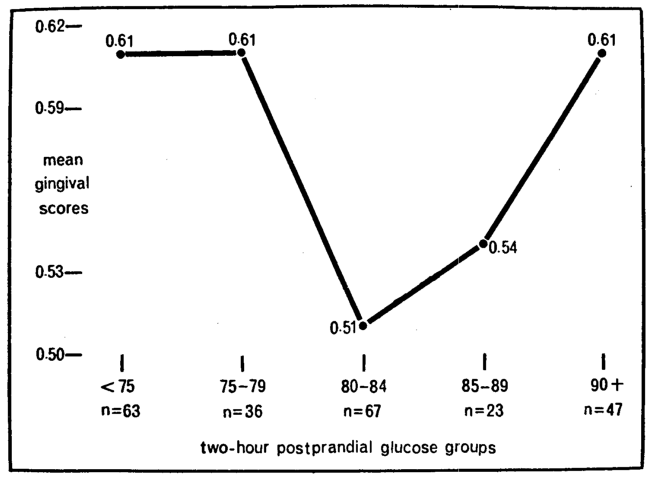
Fig. 2
Therapeutic overtones in support of the ecologic thesis would prevail if eliminating and adding refined-carbohydrate foodstuffs improved and worsened the gingiva respectively. Such an analysis was performed both qualitatively and quantitatively and recorded here (Fig. 3) is one qualitative summary. Described on the X-axis are the five subgroups as previously outlined (Table 2). Pictured on the Y-axis is the mean group percentage change derived by subtracting the final from the initial mean gingival values. It will be observed that the greatest mean percentage reduction in gingival score (35 per cent)16-17 followed the elimination of dietary refined-carbohydrates. A 15 per cent improvement was observed with the low-calorie drink.18 No change appeared with no therapy.19 There were 24 and 62 per cent worsening with sucrose19 and glucose solutions18 respectively. Here is additional proof for the ecologic theory. The gingival state appears to improve and worsen with the subtraction and addition of dietary refined-carbohydrates.
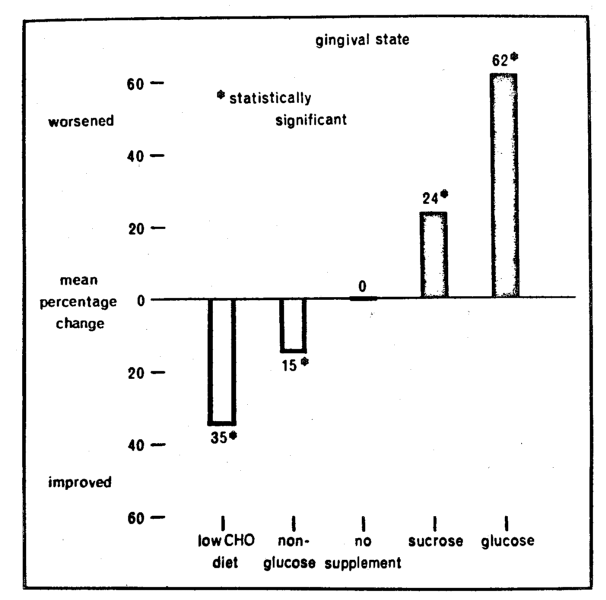
Fig. 3
The evidence thus far suggests, admittedly from group analyses, the diagnostic and therapeutic implications of carbohydrate metabolism. However, scrutiny of the individual cases emphasizes that there is considerable variability of response (Fig. 4). It will be observed that the five subgroups are arranged on the baseline. In each of these groups, only the individuals with initial mean gingival scores of 0.4 to 0.6 are included to simplify the discussion. Listed on the vertical are the mean gingival scores for these same individuals at the final visit. For example, following glucose supplementation (last column on the right) one subject with an original score of 0.4 to 0.6 worsened to 1.0. Three increased to 0.9, three to 0.8 and one to 0.7. Three, it will be observed, did not worsen. Why the variability in response? Can one predict gingival response from measures of carbohydrate metabolism?20
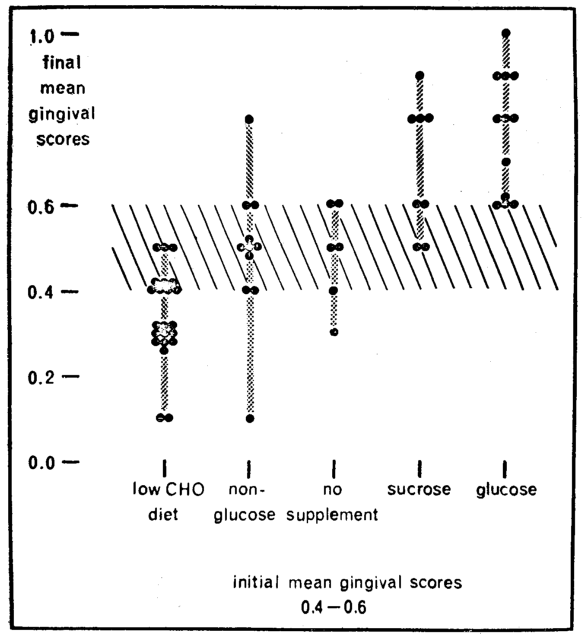
Fig. 4
It should be recalled that two-hour postprandial blood glucose was determined at each of the two visits. Shown (Fig. 5) are the values initially on the horizontal axis and at the second visit on the vertical axis. The first and foremost observation is that there is considerable variation in blood glucose. Some of the subjects vary widely at the two visits. For example, one individual had a relatively low blood glucose at the start (60 mg. per cent) and a relatively high level (110 mg. per cent) at the end. Conversely, another started with a relatively high score (110 mg. per cent) and finished with a much lower 75 mg. per cent. Still others showed a much more constant picture (like 80 mg. per cent at both visits). The question now to be resolved is « of what significance are the blood glucose patterns and their variations in terms of gingival state? »
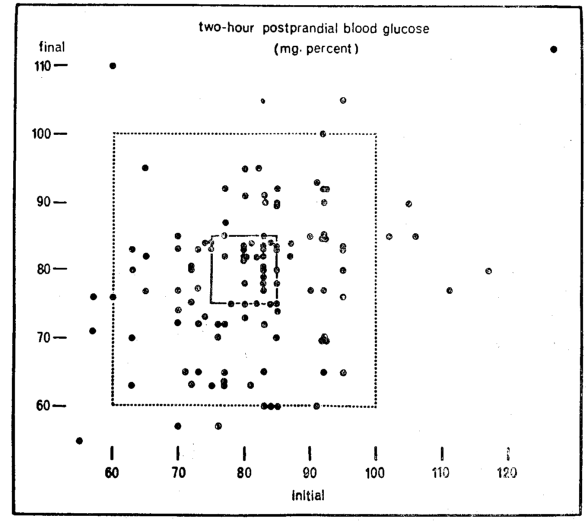
Fig. 5
There is considerable controversy regarding the physiologic range for blood glucose. The consensus is that two-hour postprandial values should range between 60 and 100 mg. per cent.21-22 These limits are demarcated by the large rectangle (Fig. 5). Thus, optimal carbohydrate metabolism is pictured within the square; suboptimal outside the boundaries of the box. On this basis, it then becomes apparent that 14 of the 118 subjects (12 per cent or one in eight) are exhibiting unsatisfactory blood glucose levels. It is a noteworthy coincidence that this figure of 12 per cent is consistent with other reports which suggest that glucose tolerance tests in mental patients yield an incidence of about 10 per cent 23 diabetes mellitus, routine urinalyses in dental patients disclose approximately 10 per cent with glucosuria.24-25
There are two valid reasons for challenging the physiologic limits of blood glucose. The present standards for blood glucose (as well as height, weight, blood pressure, tooth eruption, etc.) is derived from the mean and two standard deviations of samples of presumably healthy subjects. The assumption, by using this statistical approach, is that the values obtained for 95 per cent of a sample of the population may be regarded as healthy. The fallacy of this approach should be abundantly clear to the stomatologist. If the characteristics of 95 per cent of a group of healthy individuals may be regarded as physiologic, then it must be granted that dental caries is healthy since 95 per cent of the population demonstrates dental decay.
There is a second objection to the present limits for blood glucose. In the final analysis, life or death is a function of homeostasis.26 The cells singly and collectively as a total organism survive when host resistance can cope successfully with the many and diverse environmental threats. When the homeostatic machinery collapses, host susceptibility replaces host resistance. The same environmental challenges now overwhelm the system and disease and then death ensue. Much has been written about the mechanism which controls homeostasis (the steady state). Relatively little attention has been accorded the study of how steady is the steady state. Surely, during health, body temperature fluctuates during the day (Fig. 6). Any sudden rise or abrupt fall is immediately reflected in the clinical state (e.g. sweating and chilling). Hence, pictorially expressed, health and disease in terms of temperature may be shown by differences in amplitude. Ordinarily, the average man during the usual day has his moments of pleasure and displeasure. When these fluctuations are exaggerated so that the subject is at once manic and moments later catatonic, disease is obvious. Once again, psychologic balance and imbalance are shown by differences in amplitude. It would seem that health and disease could be plotted on the basis of the extent of the amplitudes of a constellation of physiologic, biochemical, and clinical parameters. It would appear that carbohydrate metabolism (as reflected in blood glucose) also possesses its physiologic limits. Thus, during the normal day for the healthy man, blood glucose should vary. The question is how much amplitude is physiologically acceptable. Many have written on this subject.27-34 Rene Dubos,35 in his writings about Claude Bernard and homeostasis, made the following cogent statement:
“He (Claude Bernard) emphasized that at all levels of biological organization, in plants as well as in animals, survival and fitness are conditioned by the ability of the organism to resist the impact of the outside world and maintain constant within narrow limits (italics added) the physicochemical characteristics of its internal environment.”
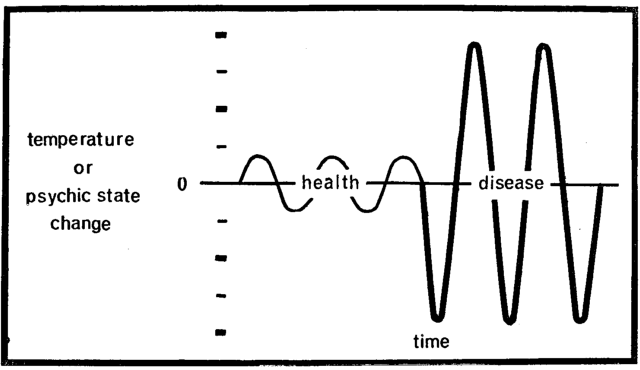
Fig. 6
On the assumption that the steady state is indeed very steady, the illustration (Fig. 5) delineates the individuals with blood glucose levels initially and finally ranging between 75 and 85 mg. per cent. This is pictured by the small rectangle. If such restricted fluctuations reflect more optimal health than 60 to 100 mg. per cent (the larger rectangle), one finds only 33 individuals within the small box and 85 outside the very small rectangle.
The question now to be answered is whether one can predict gingival response to changes in dietary carbohydrates based upon the carbohydrate metabolic state. In other words, can one explain the variability and response to dietary change utilizing carbohydrate metabolism as a reflector of resistance and susceptibility? The five dietary regimes are listed on the extreme left (Table 3). The number of persons within and outside of the small rectangle are shown. For example, of the 40 subjects who reduced refined carbohydrate foods for three days, four demonstrated blood glucose levels within 75 to 85 mg. per cent; 36 showed values below 75 and-or above 85 mg. per cent. If it is more desirable to be, metabolically speaking, within the rectangle, then two observations should be underlined. Firstly, before therapy, the four persons within the square should have better gingiva (lower scores) than those outside the small rectangle. It will be noted that the four subjects with blood glucose scores of 75 to 85 mg. per cent do indeed have a mean gingival score initially (0.50) less than the 36 individuals outside of the rectangular zone (0.61). Secondly, if the ecologic hypothesis is indeed valid, the subjects within the small rectangle should fare better after dietotherapy than those outside. In other words, the mean gingival score at the end of the experiment should be lower for those within the small rectangle. An examination of the data (Table 3) does underscore this observation. In fact, the mean score for those within the rectangle is indeed less than for those outside (0.35 versus 0.40). In short, the experience described in these 40 subjects supports the hypothesis that the constancy of carbohydrate metabolism can be utilized as a predictor of dietotherapeutic response and serves also to explain the variability of reaction to treatment.
Table 3–Relationship of two-hour postprandial blood glucose and gingival state with changes in carbohydrate metabolism.
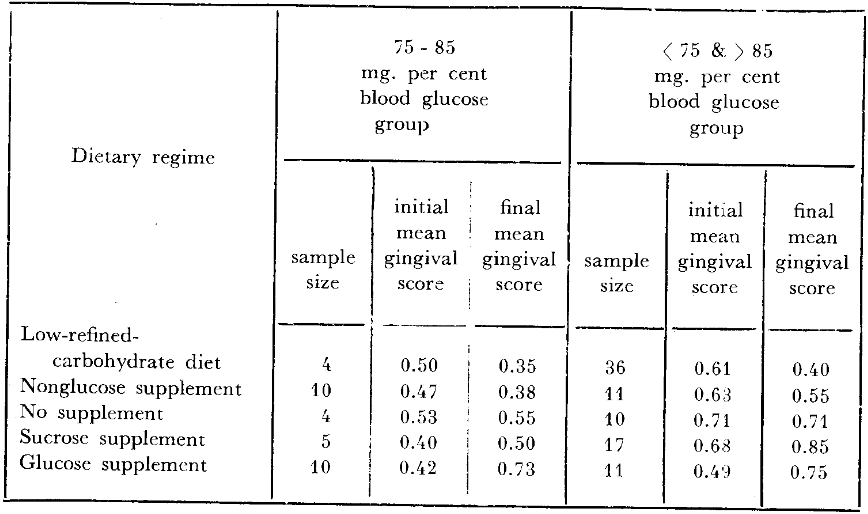
The study just outlined was accomplished without supervision. In other words, a dietary recommendation was made. Obviously, not all students cooperated to the same degree. To restudy the project under more suitable conditions, 21 individuals received a low-calorie artificially-sweetened drink indistinguishable from the glucose supplement. Parenthetic mention should be made that dietary surveys before and during this experimental period revealed that this supplement tended to reduce refined-carbohydrate intake. Utilizing the approach previously mentioned for delineating the relatively healthy from those relatively ill in terms of carbohydrate metabolism, we learn (Table 3) that 10 individuals fall within the small rectangle and 11 may be identified outside. Once again, the hypothesis may be tested. Firstly, the initial gingival scores should be lower for those within versus those outside of the rectangle. This is underscored by values of 0.47 versus 0.63 respectively. Secondly, the persons within the small box should fare better in that the final mean gingival scores should be lower. This is also shown (Table 3) by final scores of 0.38 versus 0.55. Here is now additional evidence of the prognostic worth of carbohydrate metabolism.
Mention should be made that 14 students were left untreated (Table 3). For the hypothesis to be valid, the individuals within the rectangle (as for the two preceding groups) should have lower initial scores than the outside. This is precisely the case. The four subjects showing blood glucose levels of 75 to 85 mg. per cent have a lower initial score (0.53) than those outside the rectangle with a mean of 0.71. Obviously, since no therapy was administered, one would expect that the final mean gingival scores would not be appreciably different from those at the first visit. This is also shown by values of 0.53 to 0.55 and 0.71 to 0.71. Thus, for the third time, the data support the thesis in a group subjected to no therapeutic regimen.
Thus far, the theory has been tested by eliminating refined-carbohydrate in two different ways and by a study of a group with no supplementation. The only other obvious verification must come through a study of the addition of refined-carbohydrate. It will be noted (Table 3) that one group of subjects, specifically 22, received sucrose supplementation. Within this group there were five who could be identified in the small rectangle and 17 outside of the box. Once again, there are two important items which should be emphasized. Firstly, those within the rectangle should have initial mean gingival scores lower than those outside. This is borne out by the facts. It will be noted that the score of 0.40 is characteristic of those within the square in contrast to a value of 0.68 outside of the rectangle. Secondly, one would expect that there should be worsening of the gingival state and that those outside the rectangle should fare more unfavorably. It will be observed (Table 3) that the mean scores rose from 0.40 to 0.50 within the square and from 0.68 to 0.85 outside. These limited observations confirm the thesis set forth earlier, namely that carbohydrate metabolism provides some measure of predictability of gingival response.
Finally, 21 subjects were supplied with the monosaccharide glucose in solution. The initial values of 0.42 for the ten within and 0.49 outside of the square confirm the previously noted observations. The final values of 0.73 and 0.75 demonstrate the increase in gingival scores following the supplement. Once again, here is additional data to suggest the utility of carbohydrate metabolism as a predictor of resistance and susceptibility.
Discussion
The evidence presented thus far suggests that carbohydrate metabolism may be employed for diagnostic, therapeutic, and predictive purposes with regard to gingival state. Other published reports indicate that the carbohydrate metabolic state may be correlated with other oral parameters,36,38 as well as many and diverse extraoral syndromes such a skin disease,39 peptic ulcer,40 cancer,41 multiple sclerosis,42 atherosclerosis,43 gout,44 and coronary heart disease.45 The all-important remaining question is to explain the mechanism. The categoric statement may be made that it is not known. However, there are isolated bits of evidence to suggest some of the underlying bases for the observations noted in this report as well as in other published documents. Because of time and space limitations, only two examples will be cited.
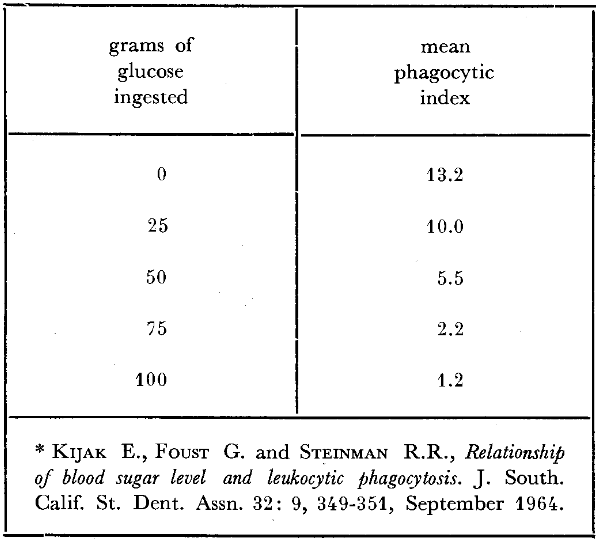
The clinician knows well the susceptibility to infection which accompanies diabetes mellitus. This, apparently, is in some manner related to phagocytosis. Studies have been performed46 (Table 4) showing a relationship between fasting blood glucose levels and corresponding phagocytic indices in diabetic patients. The technique in such an experiment is one of incubating a known number of microorganisms with blood containing different glucose concentrations. By subsequent appropriate blood staining, the number of microorganisms incorporated per leukocyte is counted. It will be observed (Table 4) that the diabetic individuals with the lowest blood glucose levels (128-178 mg. per cent) show the highest phagocytic index (3.92 microorganisms per leukocyte); those with the highest blood glucose levels (280- 380 mg. per cent) the lowest phagocytic scores (only 0.34 microbes per white cell). This relationship is not confined to the diabetic and can be experimentally demonstrated in nondiabetic individuals (Table 5). With the progressive deliberate increase of glucose under reasonably carefully controlled conditions, the mean phagocytic index progressively declines. Specifically, 45 minutes following no glucose injection, the mean phagocytic index is 13.2; after 100 grams of glucose, the index has decreased approximately 90 per cent to 1.2. Also, it can be observed that the intermediate groups in terms of glucose ingestion are paralleled by intermediate mean phagocytic indices. In short, there is evidence to suggest that carbohydrate metabolism and phagocytosis are related. Apparently, host resistance and host susceptibility are a function of the organism’s phagocytic potential.
Table 4–Fasting blood glucose levels and corresponding phagocytic indices in 45 diabetic patients*
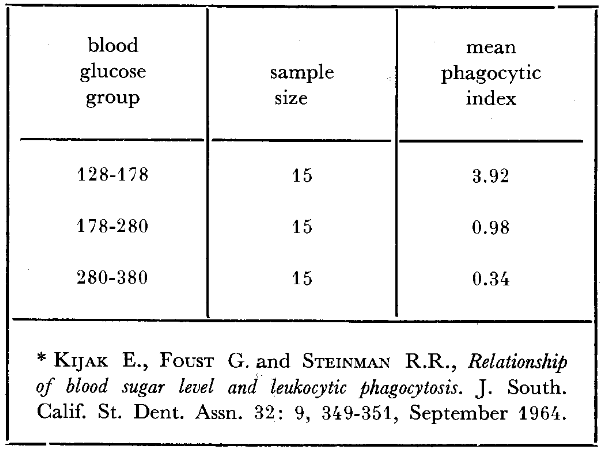
Table 5–Phagocytic indices before and forty-five minutes after varying amounts of ingested glucose *
It should be abundantly clear that carbohydrate metabolism has been employed in this report as one link between stomatology and the total organism. Obviously, all of the major foodstuffs are interrelated and the capacity to carry out essential intermediary metabolism is a function of the enzyme systems. In large measure, the holoenzyme is a protein and the coenzyme a combination of vitamins and trace minerals. Accordingly, part or all of the basis for the observations cited in this paper may be dependent upon these nutrients. There is abundant evidence (Fig. 7) that intermediary carbohydrate metabolism requires many vitamin and mineral fractions.47 For example, the phosphorylation of glucose is a function of the presence of phosphorus. The simplification of pyruvic acid to lactic acid, to select another illustration, hinges upon the amount of nicotinic acid. Hence, there is the possibility that it is such vitamin-mineral substances which play a role in the changes observed in these gingival studies.
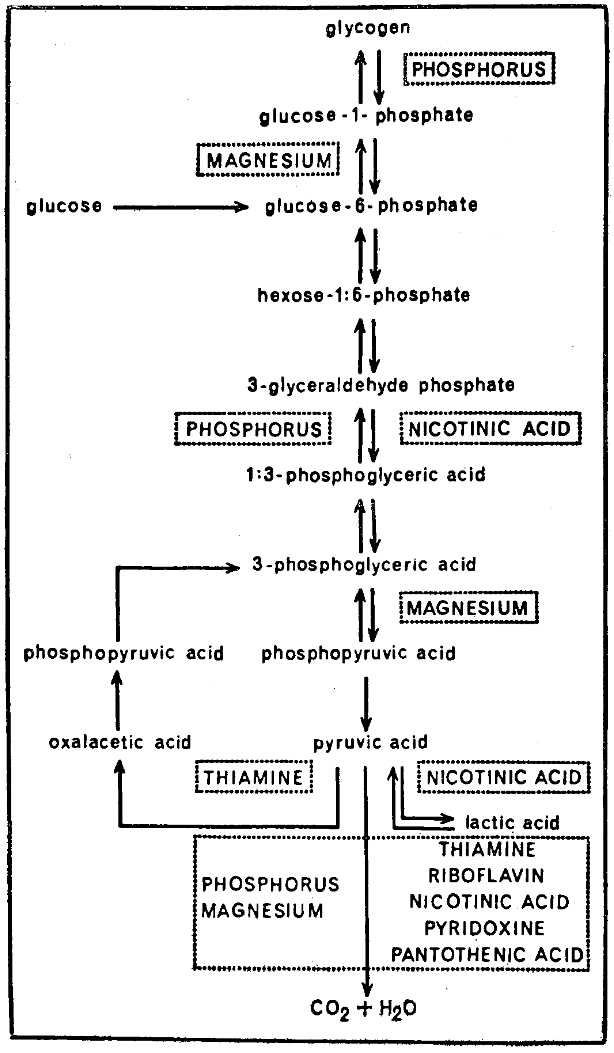
Fig. 7
Summary
An attempt has been made, within these few pages, to underscore the diagnostic, therapeutic, and predictive properties of carbohydrate metabolism in gingival health and disease. But in the larger picture, the rightful relationship of stomatology and the total organism hinges upon the acceptance or rejection of an ecologic philosophy. Much by many has been written on this issue. One, Jacques May, has described it most eloquently by utilizing a doll to symbolize the substrate and a hammer to signify the noxious world, when he wrote: “It is as though I had on a table three dolls, on of glass, another of celluloid, and a third of steel, and I chose to hit the three dolls with a hammer, using equal strength. The first doll would break, the second would scar and the third would emit a pleasant musical sound.”
References Cited:
- Somogyi M., “Determination of blood sugar.” Biol Chem. 160: 1, 69-73, September 1945.
- Nelson N., “A photometric adaptation of the Somogyi method for determination of blood sugar.” Biol. Chem. 153: 2, 375-380, May 1944.
- Pollack, H., Person P. and Knishkowy E., “Diabetes mellitus, its relation to oral pathosis. II. Oral lesions seen in diabetes mellitus.” Periodont. 18: 4, 155-158, October 1947.
- Aboul-Ela L.M., “Effect of diabetes on dental tissues.” Egyptian Dent. Jour. 2: 64-68, July 1956.
- Ziskin D.E., Siegel E.H. and Loughlin W.C., “Diabetes in relation to certain oral and systemic problems. Part I. Clinical study of caries, tooth eruption, gingival changes, growth phenomenon and related observations in juveniles.” Dent. Res. 23: 5, 317-331, October 1944.
- Rudy A. and Cohen M.M., “The oral aspects of diabetes mellitus.” New England Jour. Med. 219: 14, 503-508, October 6, 1938.
- Rudy A. and Cohen M.M., “Oral aspects of diabetes mellitus.” A.D.A. 29: 4, 523-534, April 1942.
- Kaplan N., “Oral symptomatology of diabetes mellitus.” Dent. Jour. 41: 1, 50-51, 60-61, November 1938.
- Rutledge C.E., “Oral and roentgenographic aspects of the teeth and jaws of juvenile diabetics.” A.D.A. 27: 11, 1740-1750, November 1940.
- Lovestedt S.A. and Austin L.T., “Periodontoclasia in diabetes mellitus.” A.D.A. 30: 31, 273-275, February 1943.
- Banks S.O. Jr., “Diabetes and its oral manifestations: a medicodental problem.” Nat. Dent. Assn. 4: 1, 7-11, October 1945.
- Amies G.C. and Park S.G., “Dental survey in diabetic children.” Jour. Dent. 52: 4, 233-237, July 1948.
- Martinez E., “Diabetes in dental practice.” Abst. 1: 3, 178, March 1956.
- Cheraskin E. and Keller S.E., “The normal glucose tolerance pattern: the development of blood glucose normality by an analysis of oral sign (gingival findings).” Nat. Dent. Assn. 18: 4, 93-104, July 1960.
- Keller S.E. and Cheraskin E., “The relationship of fasting blood glucose to gingival findings.” New York Jour. Dent. 32: 2, 52-62, February 1962.
- Ringsdorf W. M. Jr., and Cheraskin E., “Periodontal pathosis in man: II. Effect of relatively high-protein low-refined carbohydrate diet upon gingivitis.” New York State Dent. Jour. 28: 6, 244-247, June-July 1962.
- Cheraskin E. and Ringsdorf W. M. Jr., “Diet and gingival state.” New York State Dent. 30: 7, 275-278, August-September 1964.
- Cheraskin E., Ringsdorf W. M. Jr., Setyaadmadja A. T. S. H., Ginn D. S. and Medford F. H., “Periodontal pathosis in man: XV: Effect of glucose drinks upon gingival state.” (submitted for publication).
- Cheraskin E., Ringsdorf W. M. Jr. and Setyaadmadja A. T. S. H., “Periodontal pathosis in man: XII. Effect of sucrose drinks upon gingival state.” Pakistan Dent. Rev. 15: 4, 143-147, October 1965.
- Cheraskin E., Ringsdorf W. M. Jr. and Setyaadmadja A. T. S. H., “Periodontal pathosis in man: XI. Variability of gingival response to a relatively low-refined-carbohydrate high-protein diet.” New York Jour. Dent. 35: 6, 208-213, June-July 1965.
- H. O. and Barry E., “Criteria for and interpretation of normal glucose tolerance test.” Ann. Int. Med. 33: 5, 1175-1194, November 1950.
- Fabrykant M., “Current concepts in diabetes mellitus: laboratory aids in diagnosis.” New York State Jour. Med. 60: 23, 3846-3856, December 1, 1960.
- Waitzkin L., “A survey for unknown diabetics in a mental hospital. I. Men under age 50.” Diabetes 15: 2, 97-104, February 1966.
- Rochon R., and Moran J., “Incidence of unrecognized diabetes in dental practice.” Dent. Res. 32: 5, 677, October 1953.
- Pride T. A. and Demp S. D., “The incidence of patients with diabetes: seen in dental outpatient clinic.” Dent. Jour. 32: 5, 144-147, May 1965.
- Cheraskin E., and Ringsdorf W. M., Jr. “Homeostasis: a study in carbohydrate metabolism.” Med. Assn. State Ala. 35: 3, 173-182, September 1965.
- Frethem A. A., “Clinics on endocrine and metabolic diseases. 10. Relation of fasting blood glucose to oral glucose tolerance curve.” Staff Mett. Mayo Clin. 38: 6, 110-115, March 13, 1963.
- L. P., “When is diabetes?” Med. Clin. North America 49: 4, 893-904, July 1965.
- Ringsdorf W. M., Jr. and Cheraskin E., “Physiologic glucose tolerance test.” Progress. 2: 4, 281-284, July 1962.
- Ringsdorf W. M. Jr., and Cheraskin E., “Physiologic cortisone glucose tolerance test.” Med. Assn. State Ala. 31: 11, 359-362, May 1962.
- Cheraskin E. and Ringsdorf W. M. Jr., “Physiologic fasting blood glucose: range or point?” Dent. 16: 2, 96-98, April 1961.
- Ringsdorf W. M. Jr., Cheraskin E., and Hollis C. F., “Levels of blood sugar and blood glucose in relation to systemic and oral health.” Progress 3: 2, 121-124, January 1963.
- Ringsdorf W. M. Jr., and Cheraskin E., “Biochemical standard of health: III. Fasting blood glucose.” New York Jour. Dent. 33: 5, 185-187, May 1963.
- Cheraskin E., and Ringsdorf W. M., Jr. “Carbohydrate metabolism and carcinomatosis.” Cancer 17: 2, 159-162, February 1964.
- Bubos R. J., Mirage of Health. 1959. New York, Harper and Brothers. p. 100.
- Cheraskin E. and Ringsdorf W. M. Jr., “Resistance and susceptibility to oral disease. I. A study in gingivitis and carbohydrate metabolism.” Dent. Res. 44: 374-378, March-April 1965.
- Cheraskin E., Ringsdorf W. M. Jr., Setyaadmadja A. T. S. H. and Ginn D.S., “Resistance and susceptibility to oral disease: II. A study in periodontometry and carbohydrate metabolism.” Periodontics 3: 6, 296-300, November-December 1965.
- Cheraskin E., Ringsdorf W. M. Jr., Setyaadmadja A. T. S. H. and Ginn D.S., “Resistance and susceptibility to oral disease: III. A study in clinical tooth mobility and carbohydrate metabolism.” Calif. Dent. Assn. 41: 5, 416-420, October 1965.
- Mackenna R.M.B. and Lehman H., “Further observations on the glucose tolerance test in skin disease.” Lancet 1: 7296, 1393-1395, 29 June 1963.
- Berry M., “Is hypoglycemia an etiologic factor in ulcer?” Rec. Med. 170: 1, 53-54 January 1957.
- Benjamin F. and Romney S. L. “Disturbed carbohydrate metabolism in endometrial carcinoma.” Cancer 17: 3, 386-390, March 1964.
- Sawyer G. T., “Treatment of multiple sclerosis with tolbutamide.” A.M.A. 174: 5, 470-473, 1 October 1960.
- Waddell, W. R. and Field R. A., “Carbohydrate metabolism in atherosclerosis.” Metabolism 9: 9, 800-806, September 1960.
- McKechnie J. K., “Gout, hyperuricaemia and carbohydrate metabolism.” South African Med. Jour. 38: 10, 182-185, 14 March 1964.
- Turner N. C., Gertler M. M. and Cady L. D. Jr., “Some aspects of carbohydrate metabolism and coronary heart disease; amyloclastic action of saliva in persons prone to coronary heart disease and in normal controls.” Geriatrics 17: 1, 20-25, January 1962.
- Kijak E., Foust G. and Steinman R. R., “Relationship of blood sugar level and leukocytic phagocytosis.” South. Calif. State Dent. Assn. 32: 9, 349-351, September 1964.
- Soskin S. and Levine R., Carbohydrate metabolism. Rev. Ed. 1952. Chicago, University of Chicago Press.
- May J. M., “The ecology of human disease.” New York Acad. Sc. 84: 17, 789-794, 8 December 1960.