
Access to all articles, new health classes, discounts in our store, and more!
Serum Cholesterol and the Aging Process
Published in Medical Hypotheses, Vol. 7, pp. 685-694, 1981.
* * *
Abstract
With advancing age, the average serum cholesterol level rises. Thus, older persons generally have higher cholesterol scores than do younger individuals. Quite apart, it is a generally agreed fact that older persons die more readily than younger people. Finally, there is general agreement that older persons with higher cholesterol levels die more readily, though not necessarily of cardiovascular disease, than older people without hyper-cholesterolemia. It then follows that, all other factors being equal, lowering hypercholesterolemia is, in fact, an expression of “making people younger.”
Two hundred and twenty-one routine private practice patients were studied before and after approximately two months of routine therapy including EDTA treatment and general supportive care including multivitamin-trace mineral supplementation. The evidence indicates, within the limits of this kind of study conducted in a private practice environment, that favorable changes occurred in serum cholesterol levels suggesting a possible reversal of the aging process.
Introduction
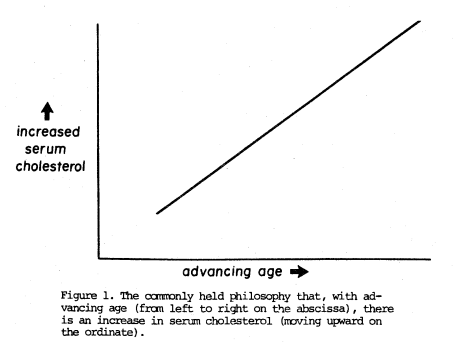
To many health practitioners, with advancing age, there is an increase in blood cholesterol. Thus, moving from left to right on the x-axis (Figure 1), one gets older and this is paralleled by a rise in blood cholesterol (Figure 1) on the y-axis. The principal justification for this hypothesis is simply that, as people get older, they do indeed generally display higher cholesterol scores. The obvious conclusion from this philosophy is that it is physiologic with advancing age to display advancing serum cholesterol scores.
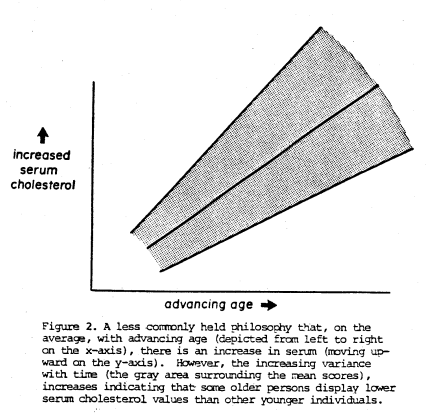
This is clearly a serious oversimplification of the relationship since it is obvious that there are, in fact, some elderly persons with lower cholesterol levels than other younger subjects. Hence, a somewhat more accurate representation (Figure 2) shows the average blood cholesterol (on the vertical axis) rising with age (on the horizontal axis). However, the surrounding gray zone recognizes that, with advancing age, there is also a progressive increase in variance.
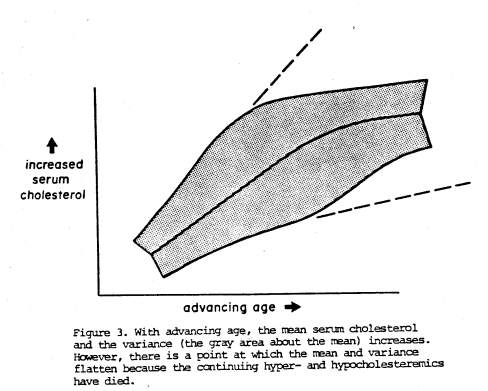
Actually, this is still not.quite consistent with the clinical facts. True, with increasing age, the average cholesterol rises (as in Figure 1). True, with advancing age, the variance also increases (as in Figure 2). However, there comes a point where the mean and the variance plateau (Figure 3) because the extremes (the very high hypercholesteremics and the very low hypocholesteremics) have died!
Review of the Literature
Wynder and Hill,1 aware of the continuing scientific and medical debate2,3,4,5,6,7,8 over what constitutes normal serum cholesterol, conducted a survey of investigators working in the field of atherosclerosis. Specifically, they circulated a questionnaire which read as follows:
Recently there has been considerable debate about the “normal” cholesterol level by the lay press and by authorities in the field of CHD. I am trying to poll key investigators as to what the normal cholesterol levels by age in men and women should be. By normal I would define that level that would satisfy the body’s need for cholesterol without causing adverse reactions.
As these investigators report, the answers were representative of clinicians, pathologists, epidemiologists, and basic researchers. Thirty-five replies funnelled in from the United States, Canada, England, Australia and South Africa.
The means and the ranges for serum cholesterol were found to be 146 (100-200), 174 (140-220), and 185 (150-250) mg% for the 10, 30, and 50 years of age, respectively.
It must be reemphasized that the question of normal serum cholesterol was directed to a group interested in a particular problem. It follows that their opinions regarding normal serum cholesterol stem from their interest in atherosclerosis and related disorders.
Cheraskin and Ringsdorf9 make the point that biochemical tests, while often characteristic of certain syndromes, are not pathognomonic of any. In other words, it is much more meaningful to view biochemical parameters as a measure of the overall syndrome of sickness. Accordingly, they undertook another approach to the problem of developing the serum cholesterol values in a progressively symptomless and sign-free group. This approach appears reasonable since the presumption can be made that, all other factors being equal, the patient without symptoms and signs (relating to arteriosclerosis and nonarteriosclerosis) is probably healthier than one with clinical findings.
The conditions of 1281 doctors and their spouses were evaluated10 in terms of the nonfasting serum cholesterol (by an automated enzyme system of chemical analysis). Clinical state was graded by the Cornell Medical Index Health Questionnaire (CMI). The CMI is a self-administered test consisting of 195 questions. Each question is answered by circling the word “yes” or “no”. The questions are phrased so that the affirmative answers indicate pathologic findings (clinical symptoms and signs). The clinical findings in this report are the total number of affirmative CMI responses (CMI score).
In the accompanying Table 1, line 1 shows that 1281 subjects with a CMI range from 0 to 125, a mean CMI score of 15.5, a serum cholesterol range from 110 to 520 mg% with a mean and one standard deviation of 224±44 mg%. Moving downward through the table (lines 2, 3, etc.), it is obvious that progressively fewer symptoms and signs are paralleled with a progressively lower mean cholesterol score and a narrower range. Thus, in the healthiest group (line 8), the very low and very high cholesterol scores have been eliminated so that the range has shrunk from 110 to 520 (line 1) to 176 to 239 (line 8). These differences are statistically significant.
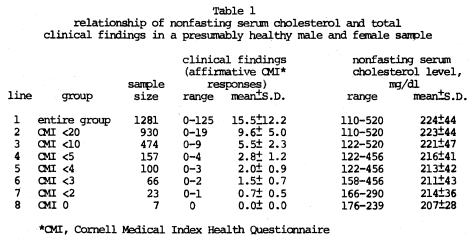
The evidence presented here from a study of presumably healthy doctors and their spouses suggests that the ideal nonfasting serum cholesterol level may approach approximately 200 mg% as derived, not from a study of atherosclerosis and related syndromes, but rather from a study of the nonspecific and more encompassing syndrome of sickness.
Materials and Methods
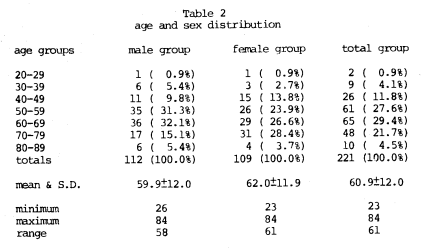
Two hundred and twenty-one routine patients were studied in a general practice environment. The age and sex distribution is summarized (Table 2). After a careful initial clinical examination, a battery of biochemical tests and other diagnostic procedures were performed. Included was a nonfasting serum cholesterol by an enzymatic procedure.11,12 Following EDTA therapy, with supportive multivitamin-trace mineral supplementation described more fully in another experiment13 for a period of approximately 30-60 days, the serum cholesterol was redetermined. The initial versus subsequent serum cholesterol was calculated, based upon age, by dividing the entire sample of 221 subjects into five near-equal subgroups according to age.
Results
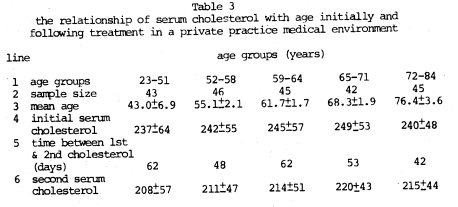
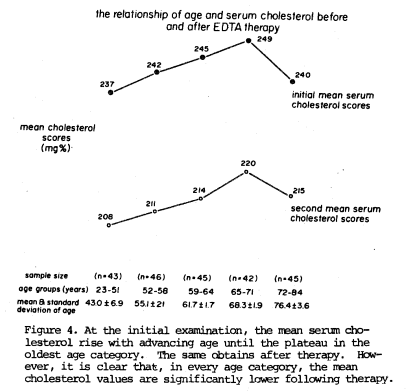
Table 3 summarizes the total information. Several points are worthy of special mention. First, it is clear that, at the initial examination, the serum cholesterol values rise with age up to a point (line 4). Figure 4 graphically depicts the pattern. In the youngest four age groups (23-51, 52-58, 59-64, 65-71 years), the mean serum cholesterol values rise slowly (237, 242, 245, and 249 mg%). Only in the very oldest group (72-84 years) does the mean serum cholesterol plateau. After a period of 42 to 62 days (Table 3, line 5) in the various age groups, the mean serum cholesterol values are again recorded. Once again, with advancing age, the mean cholesterol scores rise (208, 211, 214, and 220 mg%) until the oldest age group where there is again a plateau (215 mg%). What is most noteworthy is that, in all age groups, the average cholesterol scores following therapy are significantly lower than at the initial examination.
Discussion
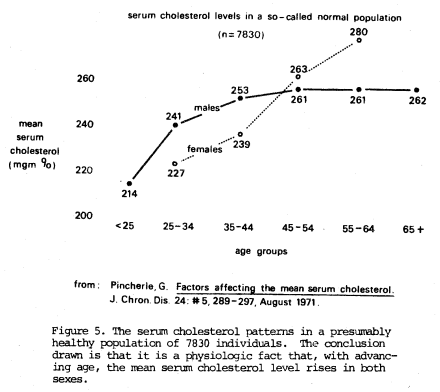
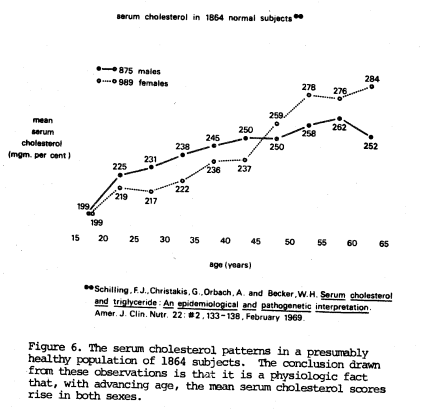
It remains a fact that, in traditional medical circles, the serum cholesterol is expected to rise with advancing age. Thus, it is routine to find different acceptable values at different ages. The patterns generally acceptable are pictured in Figures 514 and 615 which, it should be recalled, follow the principles set forth in Figure 1.
On the other hand, our findings are more consistent with the so-called norms derived by developing the symptomless and sign-free approach. It should be recalled that the “ideal” serum cholesterol, at all ages, appears to approach approximately 200 mg% (Table 1). The findings in these patients post-therapy approach 200 mg%.
Summary
It is an incontestable fact that, with advancing age, the average cholesterol rises. Older people generally have higher cholesterol scores than younger people. It is an incontestable fact that older persons die more readily than younger people. It is an incontestable fact that older persons with higher cholesterol levels die more readily though not necessarily of cardiovascular disease than older people without hypercholesterolemia.
It then follows that, all other factors being equal, lowering hypercholesterolemia is, in fact, an expression of “making people younger”.
Two hundred and twenty-one routine private practice patients were studied before and after approximately two months of routine therapy including EDTA treatment and general supportive care including multivitamin-trace mineral supplementation. The evidence indicates, within the limits of this kind of study conducted in a private practice environment, that favorable changes occurred in serum cholesterol levels suggesting a possible reversal of the aging process.
References Cited:
- Wynder, E. L. and Hill, P.: “Blood Lipids: How Normal is Normal?” Prevent. Medicine 1: 161, 1972.
- Walker, A. R. P.: “Average, Normal and Desirable.” South African Medical J. 51: 327, 1977.
- Wright, I. S.: “Correct Levels of Serum Cholesterol, Average vs. Normal vs. Optimal.” J. American Medical Association 236: 261, 1976.
- Lindgren, F. T., Adamson, G. L., Jenson, I. D., and Wood, P. D.: “Lipid and Lipoprotein Measurements in a Normal Adult American Population.” Lipids 10: 750, 1975.
- Casdorph, H. R.: “Normal Limits for Serum Cholesterol.” Lancet 1: 1076, 1972.
- Keys, A.: “Normal Serum Cholesterol.” Geriatrics 24: 61, 1969.
- Barnett, M.: “Normal Serum Cholesterol Levels.” New England J. Medicine 280: 50, 1969.
- Brown, R. K.: “Normal Serum Cholesterol Levels.” New England J. Medicine 280: 49, 1969.
- Cheraskin, E. and Ringsdorf, W. M., Jr.: Predictive Medicine: A Study in Strategy. New Canaan, Keats Publishing, Inc. 1977. p. 73.
- Cheraskin, E. and Ringsdorf, W. M., Jr.: “Another Look at the ‘Ideal’ Serum Cholesterol Level?” Archives Internal Medicine 140: 580, 1980.
- Allain, C. C., Poon, I. S., Chan, C. S. G., Richmond, W., and Fu, P. C.: “Enzymatic Determination of Total Serum Cholesterol.” Clinical Chemistry 20: 240, 1974.
- Henry, R. J., Cannon, D. C., and Winkelman, J. W.: Clinical Chemistry: Principles and Techniques. Hagerstown, Harper and Row, 1974. p. 1436.
- McDonagh, E. W., Rudolph, C. J., and Cheraskin, E.: “The Effect of Intravenous Disodium Ethylenediaminetetraacetic Acid (EDTA) upon Blood Cholesterol in a Private Practice Environment.” (submitted for publication)
- Pincherle, G.: “Factors Affecting the Mean Serum Cholesterol.” J. Chronic Disease 24: 289, 1971.
- Schilling, F. J., Christakis, G., Orbach, A., and Becker, W. E.: “Serum Cholesterol and Triglyceride: An Epidemiological and Pathogenetic Interpretation.” American J. Clinical Nutrition 22: 133, 1969.