
Access to all articles, new health classes, discounts in our store, and more!
Physiologic Glucose-Tolerance Test
Published in Dental Progress, Vol. 2, No. 4, July 1962.
* * *
Blood-glucose levels, as determined in an analysis of glucose-tolerance tests, largely dictate the diagnosis of diabetes mellitus.1-5 The range of blood-glucose levels considered normal or physiologic is derived from statistical averages of glucose-tolerance tests performed on presumably healthy individuals.
Health, in medicine, is a relative term. In this study health is relative to the disease diabetes mellitus. It is important that persons from whom our standards for blood-sugar levels have been derived should all exhibit the same degree of health relative to diabetes mellitus. The random selection of dental patients reported here indicates that our normal range may be too broad.
Review of Currently Held Concepts
Two denominators are common to the opinions of the experts regarding the physiologic range for the glucose-tolerance test results. First, the values obtained for normality are very similar. Second, the individuals from whom these ranges have been derived have been determined healthy by virtue of their being ambulatory and/or of having a negative family history of diabetes mellitus. It is assumed that no individuals thought to be diabetic by existing standards were included in these analyses.
The limits of the normal glucose-tolerance patterns have been outlined in a number of publications. Fajans6 claims that normal fasting blood glucose is below 100 mg. per cent, that the peak should not exceed 160 mg. per cent in one hour, and that the blood glucose should return to below 110 mg. per cent within two hours. These conclusions have been drawn from a study of one hundred and twenty-five non-diabetic subjects with a negative family history of diabetes mellitus.
Mosenthal and Barry,7 in a study of fifty presumed healthy hospital workers, also reached conclusions regarding physiologic ranges. They suggest a fasting blood glucose of less than 100 mg. per cent, a peak below 150 mg. per cent, and a return of the blood glucose to less than 100 mg. per cent in two hours.
Lukens’ system,8 though more complex, recognizes that fasting blood glucose should not exceed 110 mg. per cent, a peak not above 170 mg. per cent, and a return in two and three hours, respectively, to less than 120 and 110 mg. per cent.
Aims in This Investigation
The assumption is made, in publications which have set the standards for normality, that no diabetes mellitus existing in the patient and no positive family history of the disease are the only factors necessary to establish health criteria. There is no question that, all other factors being equal, persons without symptoms and signs are probably healthier, in terms of diabetes mellitus and other diseases, than those with symptoms and signs.9
In this experiment an attempt is made to develop the glucose-tolerance patterns of non-diabetic subjects who also report the absence of certain symptoms and signs generally regarded as characteristic of the diabetic state.
Method of Investigation
Eighty-nine non-diabetic subjects with a negative family history of diabetes mellitus were studied by means of the glucose-tolerance test using the Somogyi-Nelson method.10,11 Each of these individuals was questioned regarding a number of findings generally associated with diabetes mellitus. Specifically, each subject was interrogated regarding polyphagia, polyuria, polydipsia, furunculosis, and weight change.12 Also, each person was examined in regard to clinical tooth mobility and number of teeth missing. These oral signs are generally associated with the diabetic state.13 In this way three categories of individuals were created from which comparisons of glucose-tolerance test ranges could be made.
Results with Lenient Criteria
The results in Graph 1 show that procedures used in these glucose-tolerance tests resulted in values similar to those generally cited. Several features deserve particular attention. First, the smallest range is noted at the fasting level (59-101 mg. per cent). It is commonly accepted that fasting blood glucose should normally extend within the range of 60-100 mg. per cent. This is quite consistent with figures of this experiment.
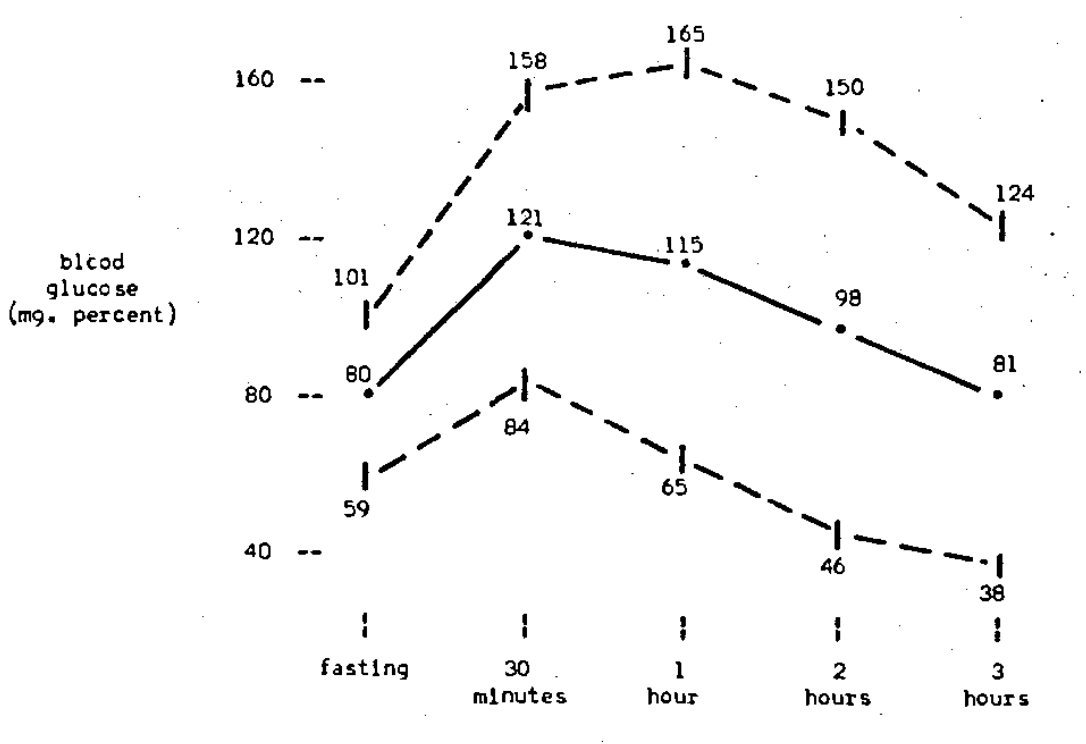
Graph 1.–Glucose-tolerance patterns of 89 non-diabetic subjects. Each subject revealed no family history of diabetes melitus.
(In all graphs, blood glucose levels were obtained during fasting conditions. Values are also plotted following breaking of the fast for periods ending at 30 minutes, 1 hour, 2 hours, and 3 hours. Central lines indicate mean values. Upper and lower lines indicate limits of standard deviation. The range for a given time (or temporal point) is represented by the difference between upper and lower lines at a given point.
Note the range between upper and lower limits of the standard deviation points at each time indicated for comparison with the other graphs. The median-line path varies less from a straight horizontal line in each succeeding graph.)
According to most investigators, the blood-glucose level should not exceed 150-170 mg. per cent within 30 minutes to 1 hour. Again, consistent results are seen in Graph 1. Finally, it is generally recognized that the blood-glucose level should return, in 2-3 hours, to the original fasting levels. Results in our study also confirm this.
Results when General Symptoms were Eliminated
Comparison of patterns obtained when individuals reporting general symptoms were eliminated from the group with patterns of the previous group shows a reduction in range at every point (Graph 2).
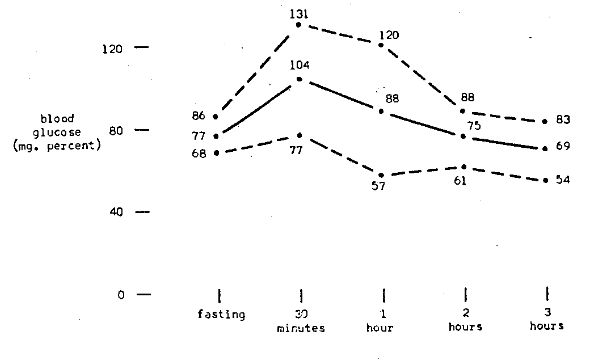
Graph 2.–Glucose tolerance patterns of 30 non-diabetic subjects. Each subject revealed no family history of diabetes mellitus. Each subject reported no occurrence of polyphagia, polydipsia, polyuria, furunculosis, or weight change.
The glucose-tolerance pattern obtained for this selected group of individuals clusters more closely about the mean than the pattern observed in Graph 1, which is derived from individuals screened only on the basis of being non-diabetic and revealing no family history of diabetes mellitus.
Results when Tooth Mobility and Loss were Also Eliminated
Glucose-tolerance test patterns for eight individuals with even fewer symptoms and signs are plotted in Graph 3. Comparison with the other graphs indicates an even further constriction of blood-glucose range at each temporal point.
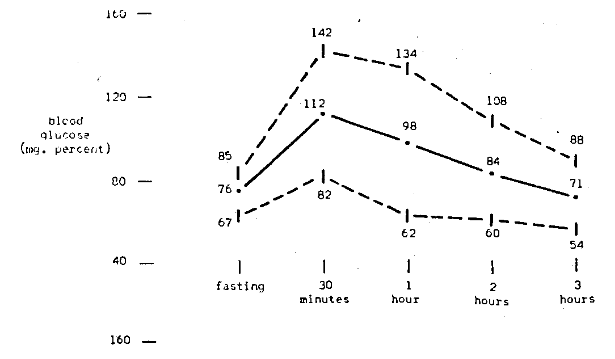
Graph 3.–Glucose-tolerance patterns of 8 non-diabetic subjects. Each subject revealed family history of diabetes mellitus. Each subject reported no occurrence of polyphagia, polydipsia, polyuria, furunculosis,or weight change. Each subject exhibited no tooth mobility or loss.
In other words, non-diabetic subjects in the following three groups cluster more about the mean than those previously observed in other groups: (1) those with a negative family history of diabetes mellitus; (2) those without the presence of polyphagia, polyuria, polydipsia, furunculosis, and weight change; and (3) those with no clinical tooth mobility and a full dental complement.
Summary
- There is general agreement, by act if not by word, that the range of blood-glucose levels considered physiologic are fairly well defined.
- The present standards determining the normal range for blood-glucose levels have been derived through statistical analyses of tests on individuals presumed healthy.
- Evidence in this study shows that, by defining health criteria as related to diabetes mellitus through insistence on progressively fewer symptoms and signs in subjects used, the physiologic blood-glucose range will progressively shrink.
- It would be well to repeat this experiment in another laboratory with other subjects and, hopefully, a larger sample. This would permit even stricter definition of health criteria. Within the limits of this study it might be postulated that physiologic blood-glucose levels might shrink–to a point!
Acknowledgments–This investigation was supported in part by a traineeship grant (2g-15) from the Epidemiology and Biometry Section, Public Health Service, and (A-2899) from the National Institute of Arthritis and Metabolic Diseases.
References Cited:
- Williams, R. H. Diabetes. New York: Paul B. Hoeber, 1960.
- Danowski, T. S. Diabetes Mellitus. Baltimore: Williams & Wilkins Co., 1957.
- Root, H. F., and White, P. Diabetes Mellitus. New York: Landsberger Medical Books, 1956.
- Williams, R. H. Textbook of Endocrinology. 2d ed. Philadelphia: W. B. Saunders Co., 1955.
- Duncan, G. G. Diseases of Metabolism. 4th ed. Philadelphia: W. B. Saunders Co., 1959.
- Fajans, S. S. “Diagnostic Tests for Diabetes Mellitus,” chap. 30, in Williams, R. H., Diabetes. New York: Paul B. Hoeber, 1960.
- Mosenthal, H. O., and Barry, E. “Criteria for and Interpretation of Normal Glucose-Tolerance Tests.” Internal Med., 33:1175-94, 1950.
- Lukens, F. D. W. “The Use of Laboratory Tests in Diabetes.” Clin. Endocrinol., 16:272-79, 1956.
- Engel, G. L. “A Unified Concept of Health and Disease.” Perspectives Biol. & Med., 3:459-85, 1960.
- Somogyi, M. “Determination of Blood Sugar.” Biol. Chem., 160:69-73, 1945.
- Nelson, N. “A Photometric Adaptation of the Somogyi Method for the Determination of Blood Sugar.” Biol. Chem., 153:375-80, 1944.
- Cheraskin, E.; Brunson, C.; and Goodwin, J. D. “Normal Glucose-Tolerance Pattern: Development of Blood-Glucose Normality by an Analysis of Extraoral Symptoms.” Periodont., 31:197-206, 1960.
- Cheraskin, E., and Moller, P. “The Normal Glucose-Tolerance Pattern: The Development of Blood-Glucose Normality by an Analysis of Oral Signs (Dental Findings).” Western Soc. Periodont., 8:81- 94, 1960.