
Access to all articles, new health classes, discounts in our store, and more!
The “Ideal” Daily Vitamin A Intake
Published in International Journal for Vitamin and Nutrition Research, Vol. 46, No. 11, pp. 11-13, 1976.
* * *
Summary: This approach suggests that the healthier the sample; the greater the daily vitamin A intake. Under the conditions of this experiment, approximately 33,0001. U. of vitamin A may be designated as the “ideal” daily allowance. This is almost seven times the RDA of 5000 I. U. for the adult male and eight times higher than the 4000 I. U. RDA for adult females.
It is recognized that the “ideal” is nonexistent as a theoretic end-point since there is biochemical individuality and because the art of measuring leaves much to be desired. Nonetheless, the technique utilized here provides a mechanism and a goal not previously considered.
Introduction
The adult RDA (Recommended Dietary Allowance) for vitamin A has been set at 1000 retinol equivalents or 5000 I. U. for the adult male and 800 retinol equivalents (4000 I. U.) for the adult female (Food and Nutrition Board, 1974). The Food and Nutrition Board grants that the RDA has been estimated from dark adaptation (visual) studies, a combination of dark adaptation and blood values, and by extrapolation from lower animal studies (Rodriguez and Irwin, 1972). There is no claim that this dosage is intended as the “ideal” daily intake for the maintenance of overall general health.
Earlier studies (Cheraskin, 1974, Cheraskin and Ringsdorf, 1974, Cheraskin et al., submitted for publication) have attempted to develop a truly “ideal” daily consumption of refined carbohydrates and vitamin C on the hypothesis that relatively symptomless and sign-free persons are healthier than those with clinical symptoms and signs. Therefore, the intake of such groups might well provide a basis for designating the “ideal” daily vitamin A consumption.
Method of Investigation
One thousand fifty-six dentists and their wives were evaluated in terms of daily reported vitamin A consumption as judged from a food frequency questionnaire. Clinical state was graded by the Cornell Medical Index Health Questionnaire (CMI). The CMI is a self-administered test consisting of 195 questions. Each question is answered by circling the word “Yes” or “No.” The questions are phrased so that the affirmative answers indicate pathology (signs and symptoms). The clinical findings in this report are the total number of affirmative CMI responses (CMI score).
Results
Table 1 shows (line 1) the daily vitamin A consumption of the entire group of doctors and their wives. In this sample of 1056, the CMI score ranged from 0-125 with a mean and one standard deviation of 15.9 ± 12.4. The daily reported vitamin A intake ranged from 1000-98209 I. U. with a mean and standard deviation of 19096 ± 11912 per diem. This is approximately four-fold the amount designated as the RDA and also four times higher than the average daily vitamin A intake for Americans–4731 I. U. (United States Department of Health, Education and Welfare, 1971-1972). The reason for this is that many of these subjects supplemented their diet daily with multiple vitamin preparations containing vitamin A. Parenthetic mention must be made that both the American Medical Association (1962) and the American Dental Association (1969) have indicated that the type of doctor interested in his own health is already above average in health. Hence, in the usual context, these values would be viewed as “ideal” since they exceed the RDA and the national mean. However, proceeding through Table 1, it is obvious that progressively fewer symptoms and signs are associated with an increasing intake of vitamin A. Deleting all subjects with 50 + symptoms and signs leaves a sample size of 1033 (line 2), a mean and standard deviation for the CMI score of 14.8 ± 10.1, and a mean and standard deviation for vitamin A of 19219 ± 12096 I. U. Exclusion of all subjects with 40 + symptoms and signs (line 3) nets a sample whose daily vitamin A intake is 19244 ± 11999 I. U. Proceeding through the eleven lines of this table, the daily vitamin A intake slowly rises as the number of allowable clinical symptoms and signs (CMI score) is reduced.
Tab. 1: Relationship of reported daily vitamin A consumption (food frequency questionnaire) and reported total clinical findings (Cornell Medical Index Health Questionnaire) in a presumably healthy male and female sample
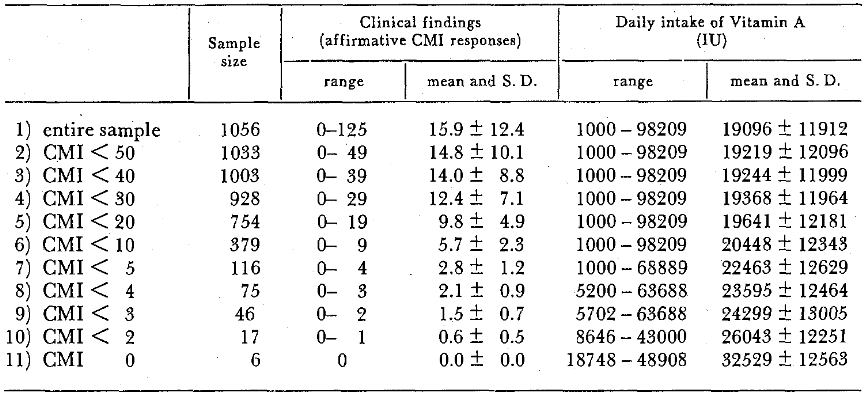
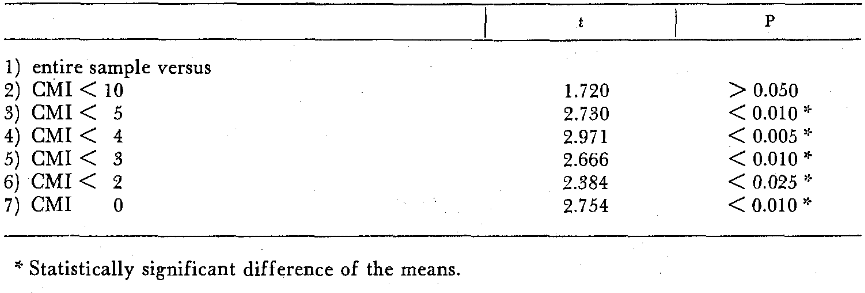
Table 2 indicates that there are statistically significant differences in the daily vitamin A intake when one compares the consumption of the entire sample and those subjects with <5 clinical findings (line 1 versus line 3).
Tab. 2: Statistical significance of the relationship of vitamin A and reported clinical findings (CMI)
References Cited:
- “ADA Health Screening Program for Dentists.” A. D. A. 79, 235 (1969).
- Cheraskin, E.: San Diego Biomed. Sympos. 13, 31 (1974).
- Cheraskin, E., Ringsdorf, W. M., Jr.: Lab. 6, 31 (1974).
- Cheraskin, E., Ringsdorf, W. M., Jr., Medford, F. H.: “The ‘Ideal’ Daily Vitamin C Intake.” (Submitted for publication).
- Editorial: “You May Be Sicker Than You Think.” A. M. A. 181, 27 (1962).
- Food and Nutrition Board, United States National Research Council-National Academy of Sciences: Recommended Dietary Allowances. National Academy of Sciences, Washington, D. C., 1974.
- Rodriguez, M. S., Irwin, D. I.: Nutr. 102, 909 (1972).
- United States Department of Health, Education, and Welfare: First Health and Nutrition Examination Survey, United States 1971-1972. 74-1219-1.