Access to all articles, new health classes, discounts in our store, and more!
The Effect of a Low-Refined-Carbohydrate High Protein Diet Upon Nonfasting Blood Calcium Phosphorus Relationships
Published in the Journal, Western Society of Periodontology, Vol. X, No. 1, March 1962.
* * *
Introduction
In earlier reports, the findings obtained from a study of the effect of a low-refined-carbohydrate high-protein diet upon non-fasting blood sugar,1 calcium,2 and phosphorus3 were analyzed. This paper will attempt to present the results derived from an analysis of the effects of a low-refined-carbohydrate high-protein diet upon calcium-phosphorus relationships. Investigation in the sphere is incomplete and quite fragmentary.
Review of the Literature
Effect of Diet Upon Blood Calcium
It is generally recognized, from both human and lower animal studies, that with an increase in dietary carbohydrates, there is a corresponding increase in blood calcium levels.2 The same direct relationship seems to exist with dietary protein and blood calcium levels.2 Information is not available to indicate which of these dietary fractions (carbohydrate or protein) exerts the dominant effect. The growing alarm concerning dietary intake in this country at the present is that protein is being neglected and refined carbohydrates highly favored.4,7
Effect of Diet Upon Blood Phosphorus
In a review of the literature by Page and coworkers,3 the general consensus of available research indicates a negative correlation between dietary carbohydrate and blood phosphorus levels. Concerning dietary protein and blood phosphorus, a positive relationship exists. Thus, as the carbohydrate intake increases, blood phosphorus is decreased. As the protein consumption rises, blood phosphorus levels are elevated.
The net result of a high-carbohydrate and/or low-protein diet (according to this literature review) is an elevation of serum calcium, a reduction in serum inorganic phosphorus, and a low calcium-phosphorus product.
Effect of Diet Upon Blood Calcium-Phosphorus Relationships
There is an abundance of experimental data concerning diet and blood levels of calcium and phosphorus. However, the effect of dietary intake upon the relationship between serum calcium and phosphorus (Ca/P ratio or Ca x P product) has received relatively scant attention.
Spiers and Sherman8 found that the calcium and phosphorus retention and calcium/phosphorus ratio were essentially the same for young albino rats receiving various forms of carbohydrates in their diets but less than animals on a controlled balanced diet. The carbohydrates used were dextrose, dextrose and maltose, dextrin, cornstarch and sucrose which constituted 25 per cent of the experimental diet. Euler and Rydhom9 have studied the serum calcium/phosphorus ratio in rats and guinea pigs on normal, vitamin C deficient, and vitamin D deficient diets. The Ca/P ratio in guinea pigs on a normal diet was 2.5:1 and in rats was 3.5:1. In both types of animals the ratio decreased on a vitamin D deficient diet (guinea pigs 1.9:1 and rats 2.9:1). The ratio increased in guinea pigs on a vitamin C deficient diet (3.1:1). Sobel and his group10 have shown that in rats the composition of the diet is reflected in the blood serum. Further, the composition of bone is related to that of the serum. Thus, there is a direct relationship between the dietary Ca/P ratio, the serum Ca/P ratio, and the Ca/P ratio of bone.
Palmer and his group11 studied the calcium x phosphorus product of cows on normal versus phosphorus-deficient diets. The plasma calcium in both groups is considered normal throughout, but the plasma phosphorus is very low in the experimental group. The Ca x P product for these animals is rarely over 30 and frequently below 20. In contrast, the control animal on an adequate diet supplemented with phosphates shows a product range of 50 to 75.
In the infants receiving undiluted milk, Nelson12 notes a calcium/phosphorus ratio of 1.3:1 to 2:1. Jones,13 by adding to the diet salts of metals which form insoluble phosphates, demonstrated a fall in serum inorganic phosphorus with no detectable rise in serum calcium. He concluded that there is no reciprocal relation between calcium and phosphorus.
Comparative analyses of forms of calcium and inorganic phosphorus in human and cows’ milk were done by Hess and Benjamin.14 The results show that, even though cows’ milk contains more calcium and phosphorus than does breast milk, rickets occurs less frequently in breastfed infants. The antirachitic superiority of human milk is apparently not due to the greater content of Vitamin D. It is thought that human milk might contain a larger amount of the most effective forms of these elements since the calcium-phosphorus ratio closely approximates that in human blood and bone (2.5:1).
Blood Calcium-Phosphorus Relationships Criteria
Calcium-Phosphorus Relationships Homeostasis: In studies conducted by Bergeim15 on albino rats, it is disclosed that calcium absorption is most efficient in the small intestines where the excretion of phosphorus is most marked and thus the intestinal calcium-phosphorus ratio is lowest. It appears that secretion of phosphates into the intestines is an important factor in prompting calcium absorption.16 Using the frog heart method4 for observations of calcium concentrations, McLean and Hinrichs17 find support for the hypothesis, of the formation in the plasma under certain conditions, of a colloidal, non-diffusible calcium-phosphate complex. They suggest that the well-known inverse relationship between calcium and phosphate depends upon the formation and removal from the blood of this complex whenever the concentration of either is augmented.
Calcium-Phosphorus Relationships Normality: According to Alquier and Michaux,18 the calcium-phosphorus ratio of the blood in the rabbit decreases after birth until, at thirty days, it becomes constant. Anderson and Elvehjem19 have performed dog experiments to determine if there is any appreciable difference in calcium and inorganic phosphorus levels in different age groups. The inorganic phosphorus level decreased progressively throughout the growing period. The only correlation made involving calcium level was a sharp rise which occurred when there was a sharp fall in inorganic phosphorus.
There are varied opinions as to whether or not there is a definite calcium-phosphorus relationship in the blood. Janson20 examined 110 patients and found no relationship between the serum inorganic phosphorus and serum calcium content. On the other hand, Wagoner,21 in presenting his views on calcium-phosphorus metabolism, states that there is a demonstrable reciprocal relationship between calcium and phosphorus content of blood serum and that the normal relationship between serum calcium and serum and organic phosphorus should be 25:1. Hartison and his co-authors22 are also of the opinion that the serum calcium level varies inversely with the concentration of serum inorganic phosphorus.
From a survey of available literature, it becomes evident that the relationship of serum calcium to phosphorus has not received the attention that has been accorded other aspects of calcium and phosphorus investigation. No particular attention has been paid to the question of the Ca/P ratio and the possibility that this ratio might be an influencing factor in mineral balance.23
Variations in the dietary ratios of calcium to phosphorus have been found to affect the calcium, phosphorus, and carbonate content of bone, dentin, and enamel in rats.24,25 Ellis and Dwyer27 demonstrated in rats that a decrease in the Ca/P ratio of their diet resulted in susceptibility of the enamel to erosion by acidic fluids. Studies by Orr indicate that rickets will not occur in the absence of vitamin D, sunlight or ultraviolet light, if the diet allows the essential minerals to be absorbed in the proper proportions.28 He further states that the amount of calcium and phosphorus in a food is not as critical as the ratio of these minerals. Thus, the calcium content of cow’s milk is much greater than human milk but the utilization in human infants is less complete. From human milk, there is an assimilation of calcium and phosphorus amounting to 81.82 per cent. From cow’s milk the percentage is 60.7 per cent.24 The optimum ratio of calcium to phosphorus in the diet is important but no exact definition is available. McCollum states that man needs a little more than half as much phosphorus by weight as he requires calcium.29
Corlette is of the opinion that the demand ratio should be the same as the Ca/P ratio in human bone.30 This ratio varies somewhat since there still is some debate as to the exact composition of the bone salts–alpha hydroxy tricalcium phosphate or hydroxylapatite. There are no generally accepted values for the Ca/P ratio of these compounds. However, when the ratio is lower than 2.14:1, there is an absorption of phosphate ions. A Ca/P ratio higher than 2.14:1 would indicate the presence of calcium hydroxide.31 The exact physiological state of bone salts is not known. Thus, the estimates of the Ca/P ratio vary from 2.14:1 to 2.35:1.22,32 McLester gives the ratio in human bone as approximately 2.25:1.33 Irving offers as the Ca/P ratio of the whole body 2.1:1.32
The ratio of 2.25:1 is very close to the European concepts of an adequate dietary Ca/P ratio and is the same proportion as is found in human milk.28,34 Tobinsek and Schneider found that an adequate diet supplemented with calcium and phosphorus in a ratio of 2.35:1 caused a maximum retention of calcium which is unrivaled except from the easiest assimilable calcium food (milk).35 Daniels and Hurron,36 in studies of infant metabolism, have shown that normal calcification takes place when calcium and phosphorus are retained in the proportion of approximately 2:1. Park recommends that the Ca/P ratio in food be such as to preserve the normal relations of these elements in the blood.37 The ratio in human serum varies from 3.4:1 to 2.09:1 with an average of 2.6:1 (calcium 9-11 mg. per cent and phosphorus 3.2-4.3 mg. per cent25).
It appears that the concentration of calcium and phosphorus in the circulating serum must play an important part in the determination of precipitation. In non-rachitic children, the serum Ca/P ratio is practically identical to the ratio of these elements in bone.38 Since a relationship seems to exist between calcification and the solubility product of CaHPO4, Howland and Kramer’s39 empirical formula, serum calcium (mg. per cent) x serum inorganic phosphorus (mg. per cent) is as reliable as the ion product itself. The proportions of Ca++ and HPO4 = to the total calcium and inorganic phosphorus are relatively constant. In adults, calcification does occur at ion concentration lower than the upper limits of solubility for CaHPO4 but the speed increases as the ion product increases.32,40 For practical purposes, the concentration product is about 30-40 for adults and about 40-55 for growing children.22
Summarizing the various figures reported, we may suppose that the optimum ratio of calcium and phosphorus, as determined from normal human serum and bone and maximum utilization from food, is approximately 2.4-2.6:1.
Method of Investigation
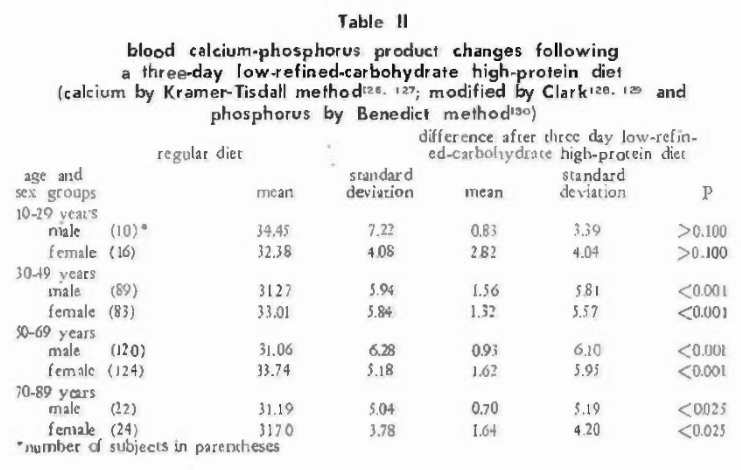
Four hundred and ninety-three ambulatory Caucasian patients were studies with regard to calcium and phosphorus metabolism as measured in the venous blood (serum calcium by the Kramer-Tisdall method,41,42 modified by Clark,43,44 and serum inorganic phosphorus by the Benedict method.45)
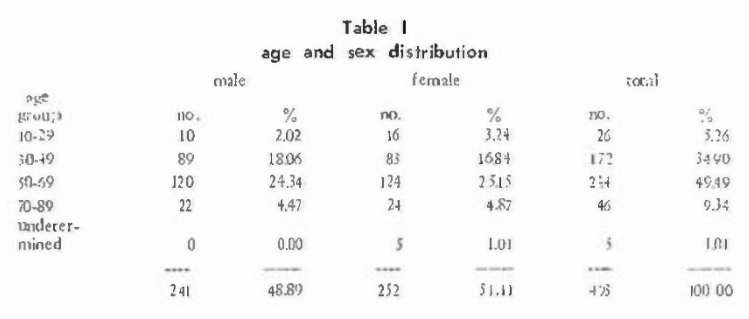
Table I shows the age and sex distribution. Generally, the sample is divided almost equally between the two sexes. The greatest number of patients, using two decade intervals, is between 50 and 69 years of age, though the subjects ranged from the second to the ninth decades. Of the sample of 493 subjects, the age was not determined in five. Therefore, in subgroup analyses, 488 subjects are used. The mean ages for the male and female group proved to be 51.78 and 50.61 years respectively.
Each patient presented in the clinic between 9:00 and 12:00 a.m. after a customary breakfast meal. A venous sample was drawn and nonfasting serum calcium and serum inorganic phosphorus determinations were performed immediately. The scores obtained will hereafter be referred to as based on a regular diet.
The patient was then given dietary instructions to follow for the next three days. Meat, fish, fowl, vegetables, whole grain (as breads, cereals, vegetables), eggs, nuts, and butter were allowed in quantities desired by the patient. Weak tea, decaffeinated coffee, natural condiments, and water were allowed ad libitum. Specific instructions were given not to eat sugar and refined sugar products, white flour foods, fruit and fruit juices, milk and milk products (except butter), preserved meats, hydrogenated fats, and alcohol. The only dietary supplement given for the three-day period was one tablet of 75 mg. of vitamin C (from rose hips) daily. Hereafter, this regime will be referred to as a basic or preparatory diet (preparatory to blood tests). In order to be as certain as possible that the instructions were followed, the patient was given a form on which all foods eaten were to be recorded during the three-day period.
Finally, the patient was instructed to return on the fourth day between 9:00 and 12:00 a.m. after breakfast based on the above recommendations. At this second visit, a venous sample was again drawn and a serum calcium and serum inorganic phosphorus determination performed immediately.
Results
The findings will be considered in two ways: (1) general characteristics, and (2) subgroup analyses.
General Characteristics
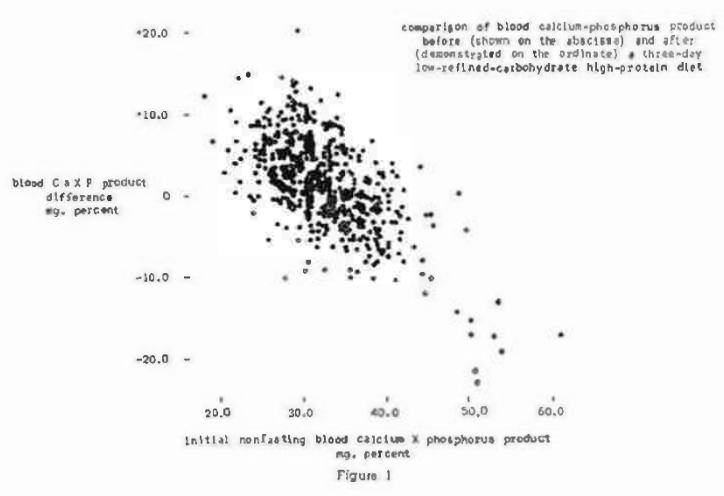
The mean initial blood calcium-phosphorus product for the 493 patients proved to be 32.30 with a standard deviation of 5.78. This can be interpreted to mean that approximately two-thirds of the patients, specifically 68 per cent, ranged from 26.52 to 38.08. This is quite in accord with postprandial determinations described earlier in this report. Three days after subsisting on the preparatory diet, the mean product rose to 33.58 with a standard deviation of the difference of 5.73.
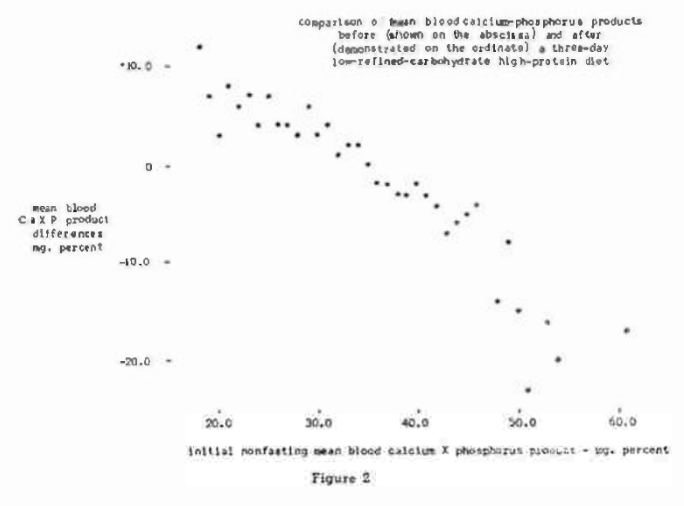
The scores obtained for the 493 patients initially and after the dietary regime are pictorially reported in Figure 1. Shown along the abscissa are the initial blood calcium-phosphorus product findings. The difference between the initial scores and the scores three days later are charted on the ordinate. It is very clear from this graph (and particularly from Figure 2 showing the mean values) that there is a definite line of regression. The coefficient of correlation for the entire group was found to be -0.635 with a P<.001. Thus the evidence seems reasonable that, under this dietary program, patients with product values above 35 tend to be reduced to or about 35. Also, it appears that those scores below 35 tend to rise to or about 35.
The question arose as to whether these changes would significantly differ if the low-refined-carbohydrate high-protein diet were to be continued for longer than three days. To answer this question, 24 subjects were studied initially (regular diet), three days later (basic diet), and several days to weeks later maintaining the same basic dietary regime. Values of 31.72 ± 4.61, 34.38 ± 4.79 and 33.24 ± 6.26 were found respectively. Thus, it appears that these levels change most significantly during the first three-day diet period.
Subgroup Analysis
Attention will be directed to a study of the nonfasting values initially and three days later in terms of age and sex. Such an analysis is shown in Table II. It can be observed that there were statistically significant changes in all age groups except the youngest (10-29 years). More detailed examination of Table II shows that in all of the age groups the tendency is for the calcium-phosphorus product to approach 35.
Discussion
The data thus far presented will be considered in the light of (1) General Characteristics, (2) subgroup analyses, and (3) the method of laboratory testing.
General Characteristics
The evidence from these 493 subjects indicates that there is a tendency for the blood calcium-phosphorus product to approach 35 under the conditions of a high-protein low-refined-carbohydrate diet and when the calcium and phosphorus are measured by the methods previously reported. This conclusion is underscored by the rise in the mean, by the very clear-cut line of regression, and the significant negative correlation.
It is, of course, hazardous to draw conclusions as to what physiologic nonfasting blood calcium-phosphorus product should be from these types of data. However, the evidence at least suggests that 35 might well be the ideal physiologic product.
The most interesting observation from this three-day dietary regime is that blood calcium-phosphorus products above and below 35 increase and decrease accordingly. These results, together with those mentioned above, make it feasible to speculate that: (1) protein and carbohydrate (other than refined) contribute measurably to the calcium-phosphorus homeostasis, and (2) the delicate hormonal regulation of this product functions more efficiently in a low-refined-carbohydrate high-protein environment. Similar findings were previously reported with regard to the effect of a low-refined-carbohydrate high-protein diet upon nonfasting blood sugar,1 serum calcium,2 and serum phosphorus.3
The relationship of calcium and phosphorus may be expressed by methods other than their product. Mention has been made of evidence which suggests that the ratio of blood calcium to phosphorus may be of the order of 25:1. In other words, the quantity of calcium in the blood is 2.5 times that of blood inorganic phosphorus. Thus, if the serum phosphorus level is multiplied by 2.5 and subtracted from the calcium value, one derives a figure which may be regarded and will be referred to in this report as excess calcium.
The mean initial excess calcium value for the 493 patients proved to be 1.87 with a standard deviation of 1.13. This can be interpreted to mean that approximately two-thirds of the patients, specifically 68 percent, ranged from 0.74 to 3.00. Three days after subsisting on the preparatory diet, the mean decreased 0.66 to 1.21 with a standard deviation of the difference of 1.16.
The scores obtained for the 493 patients initially and after the dietary regime are pictorially reported in Figure 3. Shown along the abscissa are the initial nonfasting so-called excess serum calcium findings. The difference between the initial scores and the findings three days later are charted on the ordinate. It is very clear from this graph that there is a definite line of regression. The coefficient of correlation for the entire group was found to be -0.687 with a P<.001. Thus, the evidence seems reasonable that, under this dietary regime, the excess blood calcium value seems to decrease.
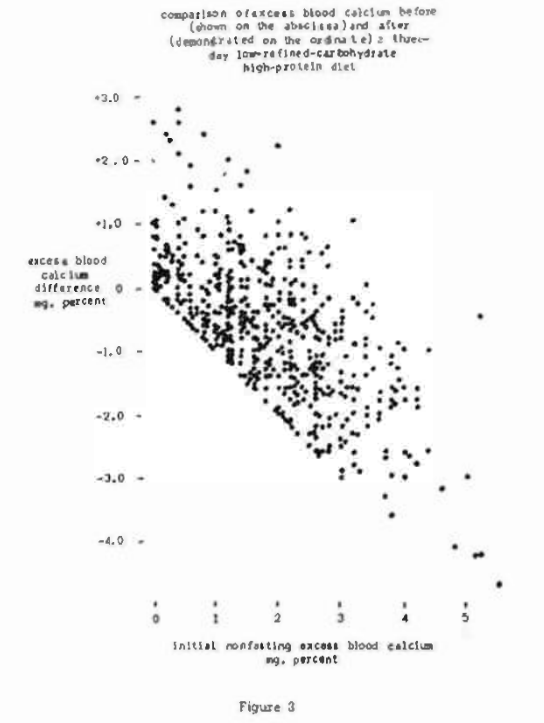
The question arose as to whether excess blood calcium changes would significantly differ if the low-refined-carbohydrate high-protein diet were to be continued for longer than three days. To answer this question, 24 subjects were studied initially (regular diet), three days later (basic diet), and several days to weeks later maintaining the same basic dietary regime. Values of 2.00 ± 1.22, 0.96 ± 0.84, and 1.28 ± 1.12 were found respectively. Thus, it appears that excess blood calcium levels change most significantly during the first three-day diet period.
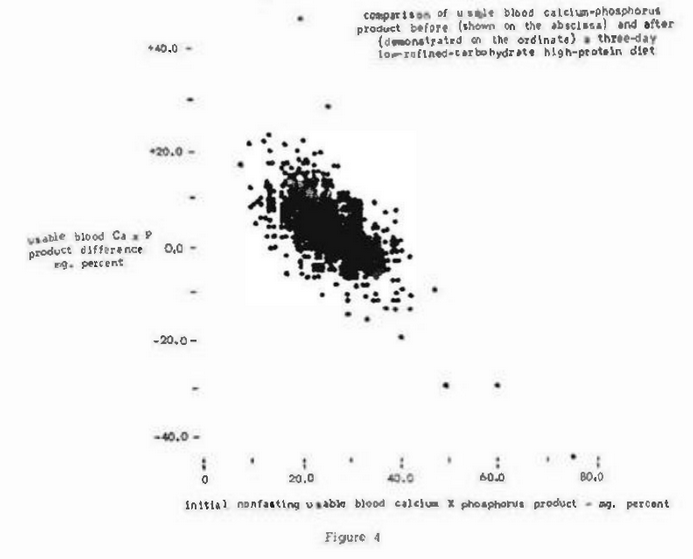
There is still another way of viewing calcium-phosphorus relationships. Let us assume that calcium and phosphorus should exist in the ratio of 2.5:1 and that the additional calcium over this limit is an excess. Then, if one multiplies the blood phosphorus level by 2.5 (amount of calcium for a 2.5:1 ratio) value by the phosphorus level, a figure is derived which will be regarded as the usable calcium-phosphorus product.
The mean initial usable calcium-phosphorus product for the 493 patients proved to be 26.78 with a standard deviation of 7.64. This can be interpreted to mean that approximately two-thirds of the patients, specifically 68 percent, ranged from 19.14 to 34.42. Three days after subsisting on the preparatory diet, the mean usable calcium-phosphorus product increased to 29.75 (a rise of 2.97) with a standard deviation of the difference of 7.98.
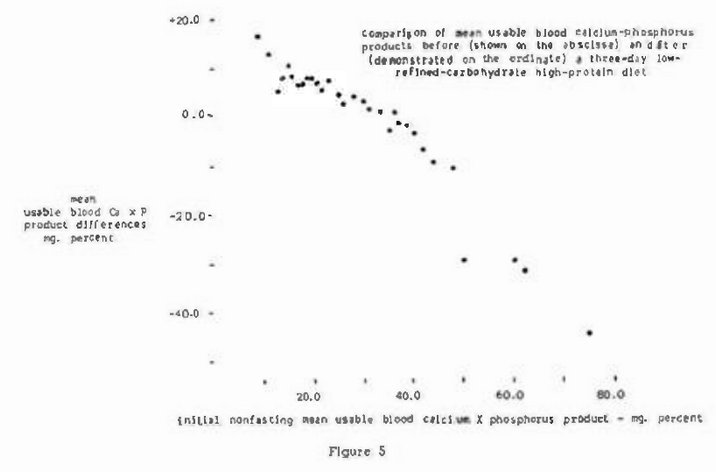
The scores obtained for the 493 patients initially and after the dietary regime are pictorially reported in Figure 4. Shown along the abscissa are the initial non-fasting so-called usable calcium-phosphorus product findings. The difference between the initial scores and the findings three days later are charted on the ordinate. It is very clear from this graph and from the mean Ca-P product differences (figure 5) that there is a definite line of regression. The coefficient of correlation for the entire group was found to be -0.609 with a P<.001. Thus, the evidence seems reasonable that, under this dietary regime, the usable calcium-phosphorus product value seems to increase.
The question arose as to whether the usable calcium-phosphorus product changes would significantly differ if the low-refined-carbohydrate high-protein diet were to be continued for longer than three days. To answer this question, 24 subjects were studied initially (regular diet), three days later (basic diet), and several days to weeks later maintaining the same basic dietary regime. Values of 25.66 ± 6.49, 31.26 ± 6.44 and 29.38 ± 6.78 were found respectively. Thus, it appears that the usable blood calcium-phosphorus product changes most significantly during the first three-day diet period.
Subgroup Analyses
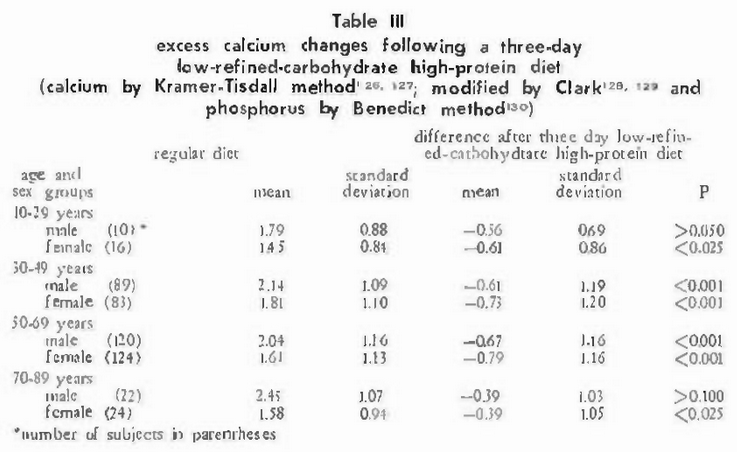
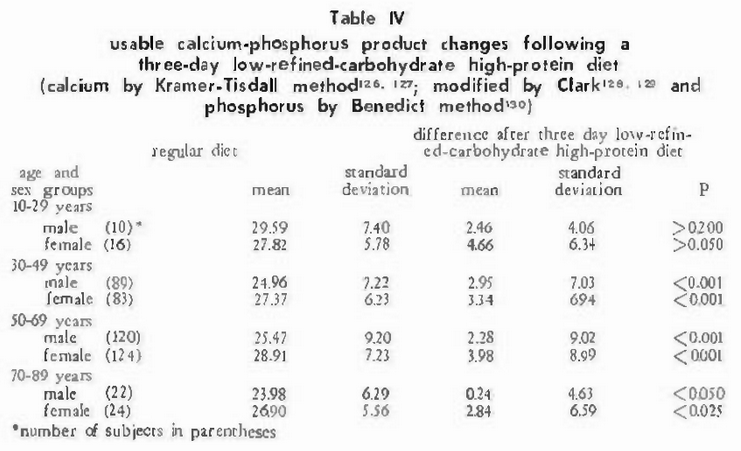
A study of the age and sex differences has been summarized in Table II. it can be observed that the changes in the youngest age group are not significant. This is precisely the finding previously reported with regard to blood sugar,1 calcium,2 and phosphorus.3 Also, Table II shows that the most significant differences occurred in the 30-49 and the 50-69 year age group. Significant, but less so, are the findings in the oldest age category. One can speculate that the imbalance in very elderly people may be so great that dietary change alone is incapable of righting the calcium-phosphorus relationships. Whether this is the entire explanation or only part of it cannot be concluded from this particular study.
The age and sex findings were also computed for excess calcium (Table III) and usable calcium-phosphorus product (Table IV). The fact that the very same findings occur by three different techniques is just a little more evidence that the explanation for the lack of significance in some age groups is tenable.
Method of Laboratory Testing
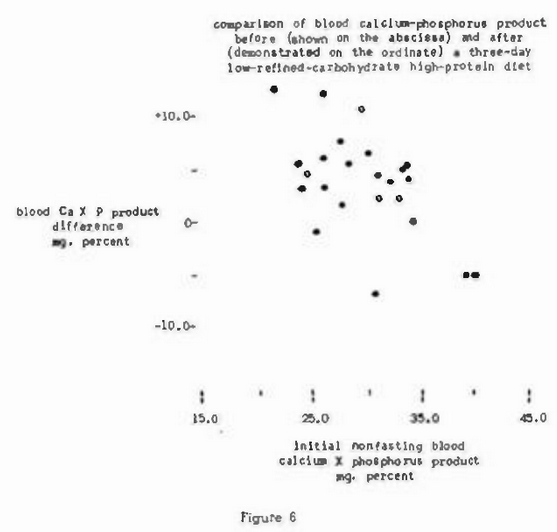
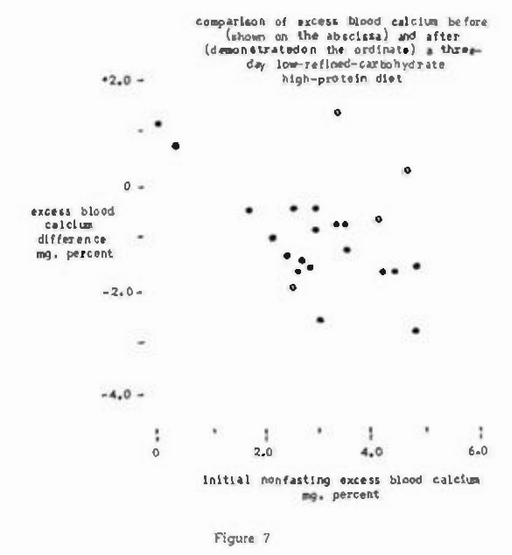
Attention should be directed to the fact that blood calcium and phosphorus in the 493 subjects was determined by the Kramer-Tisdall method modified by Clark and by the Benedict method. It was thought important to establish whether similar patterns would be derived by studying blood calcium-phosphorus relationships by other techniques. Accordingly, 23 subjects were investigated as previously described except that the serum calcium and phosphorus levels were done by other techniques.48-49
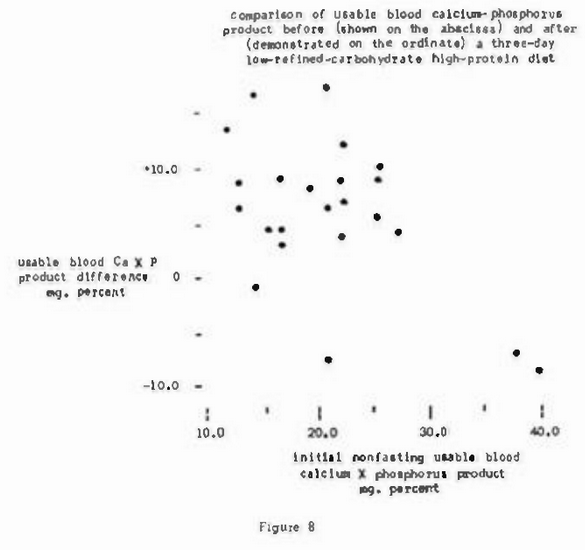
Figure 6 shows that the blood calcium-phosphorus product values above and below approximately 35 following the three-day diet decreased and increased respectively to or about 35. Specifically, at the start of the study, the blood calcium-phosphorus product was found to be at 29.5 ± 4.83. Three days later the mean increased to 33.0 and the standard deviation decreased to 4.34. The statistical significance of the change is shown by a coefficient of correlation of -0.605 and a P of <.01. Thus, the findings by these techniques agree with the overall observations made earlier where, it should be recalled, there was a statistically significant difference between the initial calcium-phosphorus product and the observations three days later after correction of diet. Figure 7 shows that the excess blood calcium values decreased considerably. Specifically, at the start of the study, the excess blood calcium value was found to be 3.02 ± 1.25. Three days later the mean decreased to 2.00 and the standard deviation shrunk to 1.19. Finally, Figure 8 shows that the usable blood calcium-phosphorus product, at the start of the study, showed a mean of 21.4 in a standard deviation of 7.2. Three days later this value rose to 26.7 ± 6.7.
It should be indicated that the changes in calcium-phosphorus relationships under this dietary regime are quite similar to those reported for blood sugar and glucose,1 serum calcium,2 and serum inorganic phosphorus.3 In all instances the values decreased to a relatively narrow range. This suggests the possibility that the physiologic range for blood sugar, glucose, calcium, and phosphorus may be more limited than is currently held.
Summary
- Analyses of non-fasting blood calcium-phosphorus relationships on 493 patients were made initially (during a period of regular diet) and three days after a high-protein low-refined-carbohydrate regime.
- Evidence is presented to show that, under this dietary regime, non-fasting calcium-phosphorus relationships tend to seek a more narrow physiologic range than is currently recognized.
- The presented data indicates that the more significant changes are found in the 30 to 69 year old age brackets.
- It appears, at least presumptively, that 35 may well be the ideal (physiologic) non-fasting blood calcium-phosphorus product value.
- Data is presented to show that two theoretic applications of the relationship between calcium and phosphorus, termed excess calcium and usable calcium-phosphorus product, compare very favorably with the calcium-phosphorus product.
References Cited: