
Access to all articles, new health classes, discounts in our store, and more!
Daily Vitamin E Consumption and Reported Cardiovascular Findings
Published in Nutrition Report International, Vol. 2, No. 2, August 1970
* * *
Abstract
One hundred seventy-one dental practitioners and one hundred twenty-eight wives were studied on one occasion in terms of reported daily vitamin E consumption and reported cardiovascular symptoms and signs. From this group, a second such clinical-dietary comparison was made on 58 males and 37 females approximately one year later. Five points are apparent. First, the data confirm the well-established clinical fact that, with advancing age, there is an increase in the frequency of cardiovascular findings. Second, the not-too well-known observation was made that there is no correlation between age and the daily vitamin E intake. Third, an examination of the relationship of age and cardiovascular findings shows that the increase in clinical findings parallels age only in the subjects consuming less than the Recommended Dietary Allowance for vitamin E. Additionally, the difference in the number of cardiovascular symptoms and signs is most sharply evident in the relatively oldest subjects. Fourth, a review of the change in vitamin E intake during the experimental year shows that the decrease in cardiovascular findings occurred in the group of subjects characterized by an increase in vitamin E consumption. Finally, the evidence suggests that vitamin E may play a more significant role than heretofore recognized.
Introduction
Although vitamin E was discovered over forty years ago and numerous animal experiments have revealed a broad variety of deficiency symptoms, only recently have overt signs of deficiency been recognized in man. The incidence of such signs in man appears relatively low, but they are sufficiently numerous and varied to establish a positive correlation between vitamin E deficiency in man and that in other animals and to serve as a sound basis for extending the comparison to the less obvious symptoms and conditions which might characterize a marginal deficiency. Faced with the knowledge that man requires vitamin E, that the vitamin E content of many foodstuffs is low, that a number of observations suggest an incidence of suboptimal nutrition of vitamin E and that several presumably normal populations have shown signs of vitamin E deficiency, it is evident that every reasonable step should be taken to assure the normal requirement to healthy persons and a generous amount to the ill…
This citation1 serves as a prelude to and justification for a consideration of the relationship of vitamin E consumption and cardiovascular findings. In this connection, the emphasis to date has been with regard to vitamin E and erythrocyte hemolysis. As far as can be determined, there is no published report on the relationship of vitamin E intake and early reported cardiovascular symptoms and signs. Accordingly, an attempt will be made in this report to answer the following questions.
- What is the relationship of age and reported cardiovascular findings in a presumably healthy population?
- Is there a correlation between age and the daily intake of vitamin E in this same group?
- Are there parallelisms between age and cardiovascular findings in terms of vitamin E consumption?
- Do the changes in the cardiovascular pattern over a one-year period parallel the changes in the daily vitamin E intake?
Method of Investigation
At each of the two visits, the age and sex was recorded. Table I is a:summary of the age and sex distribution. Parenthetic mention should be made that the eight readings in the second decade represent children of the dental families.
Table I–age distribution
| age groups | males | females | entire sample |
| 10-19
20-29 30-39 40-49 50-59 60-69 70-79 |
3 [1.3%]
6 [2.6%] 71 [31.0%] 80 [34.9%) 53 [23.1%] 14 [6.1%] 2 [0.9%] |
5 [3.0%]
20 [12.1%] 50 [30.3%] 56 [33.9%] 25 [15.2%] 7 [4.2%] 2 [1.2%] |
8 [2.0%]
26 [6.6%] 121 [30.7%] 136 [34.5%] 78 [19.8%] 21 [5.3%] 4 [1.0%] |
| total
mean S.D. minimum maximum range |
229 [100.0%]*
44.3 10.0 13 76 63 |
165 [100.0%]*
40.8 11.2 10 79 69 |
394 [100.0%]*
42.9 10.7 10 79 69 |
*approximate
On both occasions, each subject completed the Cornell Medical Index Health Questionnaire.2 Section C [thirteen questions] relates to the cardiovascular system. The distribution of positive responses is summarized [Table II].
Table II–reported cardiovascular findings
| number of cardiovascular findings | males | females | entire sample |
| 0
1 2 3 4 5 6 7 |
100 [43.7%]
70 [30.6%] 37 [16.2%] 13 [5.7%] 4 [1.7%] 4 [1.7%] 1 [0.4%] 0 [0.0%] |
59 [35.8%]
52 [31.5%] 26 [15.8%] 14 [8.5%] 4 [2.4%] 6 [3.6%] 3 [1.8%] 1 [0.6%] |
159 [40.4%]
122 [31.0%] 63 [16.0%] 27 [6.9%] 8 [2.0%] 10 [2.5%] 4 [1.0%] 1 [0.3%] |
| total
mean S.D. minimum maximum range |
229 [100.0%]
1. 0 1. 2 0 6 6 |
165 [100.0%]
1.3 1.5 0 7 7 |
394 [100.0%]*
1.1 1.3 0 7 7 |
* approximate
At both visits, each participant completed the Dietronic Dietary Analysis. This is a dietary questionnaire based upon food frequency.3 The completed form is submitted to a computer center and a readout is provided. For purposes of this study, only the daily vitamin E intake was utilized. The distribution is shown [Table III].
Table III–daily vitamin E consumption
| daily vitamin E intake [I.U.] | males | females | entire sample |
| 0-4
5-9 10-14 15-19 20-24 25-29 30+ |
0 [0.0%]
14 [6.1%] 26 [11.4%] 40 [17.5%] 37 [16.2%] 35 [15.3%] 77 [33.6%] |
1 [0.6%]
8 [4.8%] 27 [16.4%] 34 [20.6%] 36 [21.8%] 30 [18.2%] 29 [17.6%] |
1 [0.3%]
22 [5.6%] 53 [13.5%] 74 [18.8%] 73 [18.5%] 65 [16.5%] 106 [26.9%] |
| total
mean S.D. minimum maximum range |
229 [100.0%]*
24.3 9.3 5.9 56.1 50.2 |
165 [100.0%]
21.8 8.2 4.1 38.0 33.9 |
394 [100.0%]*
23.3 8.9 4.1 56.1 52.0 |
* approximate
Results
Question One: In order to resolve the first question, age [on the abscissa] was correlated with cardiovascular findings [on the ordinate] for the males and females separately [Figure 1]. It is clear that there are low but statistically significant positive correlations [r =+0.150, P<0.05; r = +0.175, P <0.05]. Hence, in answer to the first question, the data confirm the well-established fact that, with advancing age, there are progressively more cardiovascular symptoms and signs.
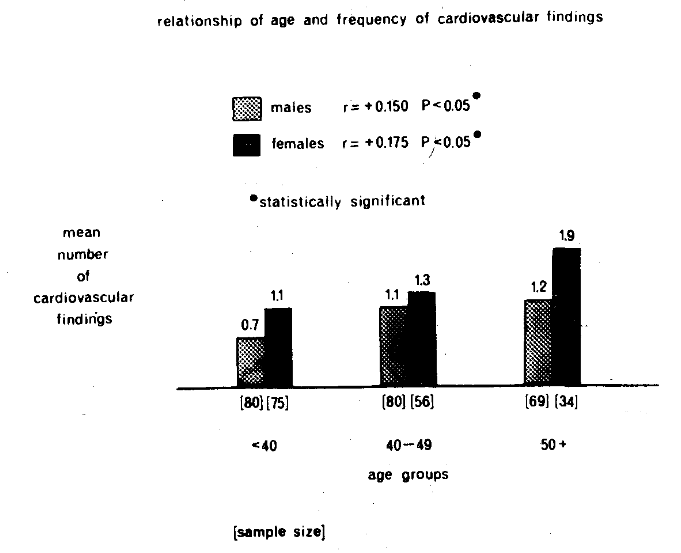
Figure 1. The relationship of age [on the abscissa] and the frequency of reported cardiovascular findings [on the ordinate]. In both the male and female groups, there is a low but statistically significant correlation.
Question Two: Figure 2 pictorially portrays age [on the horizontal axis] and mean daily vitamin E intake [on the vertical axis.]. Within the limits of these observations, and in answer to this second question, there is no statistically significant parallelism between age and daily vitamin E consumption in either sex.
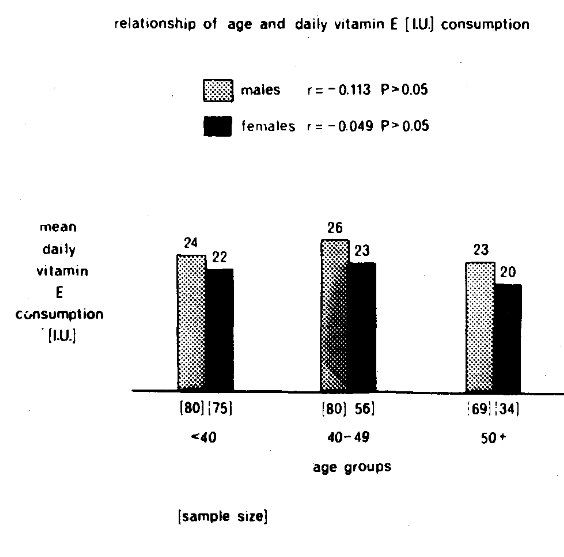
Figure 2. The relationship between age [on the horizontal axis] and reported daily vitamin E consumption [on the vertical axis]. There is no statistically significant parallelism in either sex.
Question Three: The point now to be resolved is whether the parallelism between age and cardiovascular findings [Figure 1] is a function of vitamin E intake. According to the Recommended Dietary Allowances, the male should consume 30 I.U. of vitamin E daily. Accordingly, the male group was divided into those consuming less than 30 I.U. and 30+ I.U. Figure 3 shows on the x-axis age and on the y-axis mean number of cardiovascular findings. The black columns represent the subjects consuming suboptimal amounts of vitamin E; the stippled bars the acceptable consumption. Four points merit emphasis. First, there is a statistically significant positive correlation [r = +0.197, P<0.05] between age and cardiovascular findings in the group with the suboptimal vitamin E intake. Second, the correlation for this group is slightly higher [r = +0.197] than for the entire male group [r = +0.150]. Third, a study of the individual age groups shows that a statistically significant difference prevails only in the oldest category [t = 2.740, P<0.01]. Finally, there is no increase in clinical findings with age in the group consuming the so-called adequate amount of vitamin E. A similar study in the female group was also carried out [Figure 4]. The only difference in the analysis is that 25 I.U. were used as the delineating point since this is the suggestion put forth in the Recommended Dietary Allowances. The observations with the female group are precisely those previously outlined for the males. Hence, in reply to the third question, cardiovascular findings do indeed increase with age but only in those subjects consuming suboptimal amounts of vitamin E.
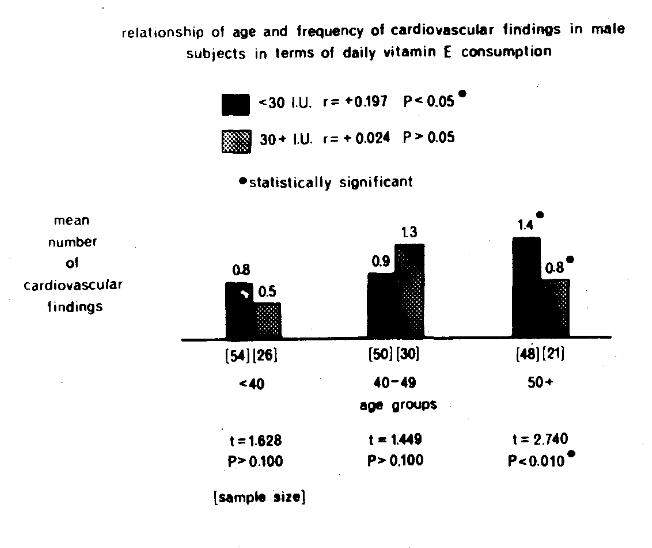
Figure 3. The relationship of age [on the x-axis] and reported cardiovascular findings [on the y-axis] in terms of reported daily vitamin E intake <30 I.U. [black columns] and 30+ I.U+ [stippled bars] in male subjects. With advancing age, there is a statistically significant [r = +0.197, P <0.05] increase in cardiovascular symptoms and signs only in the group consuming less than 30 I.U. daily which is below the Recommended Dietary Allowances. Additionally, intragroup examination by age shows only a statistically significant difference [t = 2.740, P<0.01] in the oldest age category [50+ years].
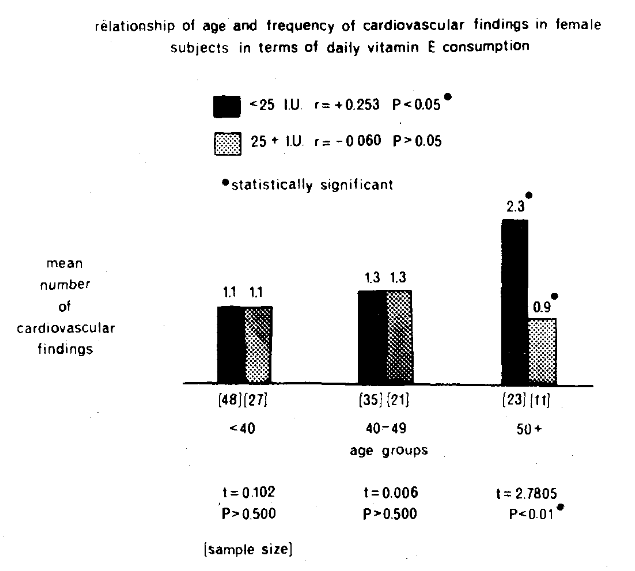
Figure 4. The relationship of age [on the abscissa] and reported cardiovascular findings [on the ordinate] in terms of reported daily vitamin E intake <25 I.U. [black columns] and 25+ I.U. [stippled bars] in female subjects., With advancing age, there is a statistically significant [r = +0.253, P<0.05] increase in cardiovascular symptoms and signs only in the group consuming less than 25 I.U. daily which is below the Recommended Dietary Allowances. Additionally, intragroup examination by age shows only a statistically significant difference [t = 2.7805, P<0.01] in the oldest age category [50+ years].
Question Four: The observations thus far are simply of a correlative nature. No conclusions can be drawn from such data regarding causation. After the initial study was completed, the group convened to learn the findings and possible dietary changes to be effected. For example, it was pointed out that approximately 80 per cent was subsisting on less than the recommended intake of vitamin E. Parenthetic mention should be made that this observation is consistent with the earlier citation.1 Lectures were conducted to show how the diet could be changed to correct this deficiency.
Approximately one year later the group reconvened. The Cornell Medical Index Health Questionnaire was completed again. The Dietronic Dietary Analysis was again performed. This provided the opportunity to observe the cardiovascular state and the vitamin E consumption for a second time and to compare the findings with the original data. This was possible in 58 males and 37 females.
The entire sample could be divided into four groups. Group I [n = 74] consisted of those subjects who increased their vitamin E intake during the experimental one-year period. Group II [n = 1] included the one individual with no change in daily vitamin E consumption. Group III [n = 20] could be characterized as embracing the people whose daily vitamin E intake declined. Group II will not be considered because of sample size.
Figure 5 pictorially portrays the results. On the abscissa are the groups. On the ordinate [on the left] is an analysis of the daily vitamin E intake. The stippled columns signify the initial values; the black bars the final scores. It is obvious that in Groups I and III there are statistically significant differences since the groups were so created. On the right are the mean cardiovascular scores. In Group I, characterized by an increase in daily vitamin E, there is a statistically significant decline in cardiovascular findings [1.3 to 0.9] as shown by t = 2.602, P <0.025. In Group III [which reduced its vitamin E] there is a slight [1.0 to 1.2] but not statistically significant [t = 0.396, P >0.500] rise in reported cardiovascular symptoms and signs.
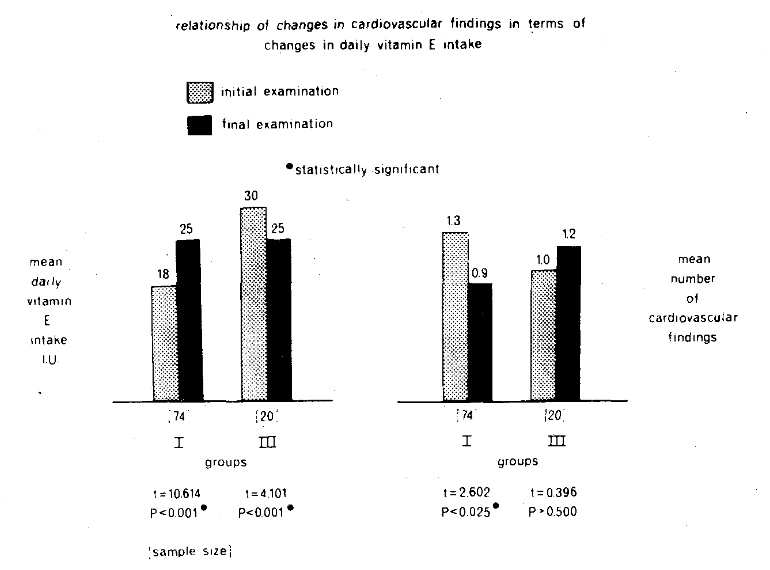
Figure 5. The relationship of change in reported daily vitamin E intake [left side] and change in reported cardiovascular symptoms and signs [right side] in subjects who increased daily vitamin E intake [Group I] and who decreased daily vitamin E consumption [Group III]. Only in Group I is there a reduction [1.3 to 0.9 complaints per person] in cardiovascular findings of statistical note [t = 2.602, P<0.025].
Discussion
The point should be underlined that this is not a controlled experiment in the usual sense. Hence, the results must be viewed with caution. Notwithstanding, several items should be underscored. First, the study supports the well-known clinical fact that, with advancing age, people report progressively more cardiovascular symptoms and signs. Second, the evidence suggests no parallelism between daily reported vitamin E intake and age. Third, within the limits of this study, the relationship between age and cardiovascular findings is, in part, a function of vitamin E consumption. More specifically, age and cardiovascular findings correlate only in subjects consuming less than the Recommended Dietary Allowances for vitamin E. Finally, the evidence presented in the preceding three items is purely correlative and, therefore, no causation can be ascribed. However, an examination of the cardiovascular patterns over a one-year period in the light of changes in vitamin E consumption following dietary instruction, suggests possible causation. In other words, during this interval, those who increased vitamin E intake were paralleled by a decrease in cardiovascular symptoms and signs. Those who did not increase vitamin E consumption did not improve with regard to the clinical picture.
It is hoped that the observations reported here will catalyze interest in this apparently new area and generate additional study.
References Cited:
- Herting, D. C. “Perspective on vitamin E.” Amer. J. Clin. Nutr. 19, 210 [1966].
- Brodman, K., Erdman, A. J., Jr., and Wolff, H. G. Cornell Medical Index Health Questionnaire. 1949. New York, Cornell University Medical College.
- Abramson, J. H., Slome, C., and Kosovsky, C. “Food frequency interview as an epidemiological tool.” Amer. J. Pub. Health, 53, 1093 [1963].