
Access to all articles, new health classes, discounts in our store, and more!
Clinical Correlations Between Serum Glucose Variance and Reported Symptoms In Human Subjects
Published in Medical Hypothesis, Vol. 15, No. 1, pp. 67-79 September 1984.
* * *
Abstract
The evidence presented in this report suggests that, in both a healthy people and patient populations, there are clinical and biochemical (fasting serum glucose) gradations of health and sickness. What is particularly fascinating is the fact that, as one progressively develops a symptomless and sign free subset, the blood glucose levels become more homogeneous, meaning that glucose scores cluster to the mean. This enhances the diagnostic, therapeutic and predictive utility of blood glucose scores. While such clinicobiochemical parallelisms are clear, it is essential to mention the point that they do not necessarily prove cause-and-effect. But our interest has been sufficiently stimulated to study several other possible correlates between biochemical variances and the degree of reported symptomatology.
Introduction
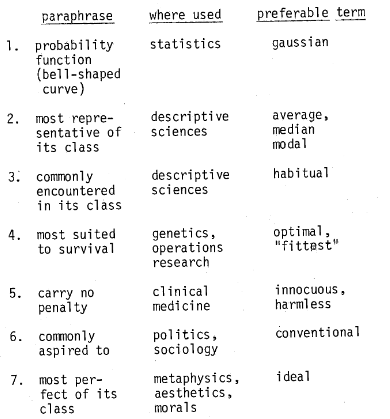
Clearly who is thought to be well or ill is a function of where one draws demarcating lines. This apparent complexity of choice has, as one might anticipate, resulted in a plethora of published material as to what constitutes the “normal fasting blood glucose.” One of the reasons for the quantity and diversity stems from the fact there might well be at least seven different definitions for “normal.” Murphy has outlined these possibilities (Table 1). The last, the “ideal,” the most desired has been accorded the least attention.
Table 1–Murphy’s seven definitions for “normal”
The purpose of this report is to attempt to answer the following questions:
- Are there any differences in the values in a “patient” versus a “healthy” people sample?
- Are glucose scores systematically related to number of symptoms within the “patient” group?
- Are glucose scores systematically related to number of symptoms within the “healthy” people sample?
- Can one draw any philosophic and practical conclusions from these subsets of data on fasting blood glucose?
Review of the Literature
Hale-White and Payne2 indicated, as early as 1926, what has since become common that “in selecting subjects for the formation of normal standards, it has been thought inadvisable to take patients from either the medical or the surgical wards of a hospital. Material for the study is available…among the students and laboratory workers.” Himsworth,3 about 9 years later, described his criteria for normality and emphasizes the importance of the absence of diabetes mellitus as follows, “the experiments were carried out on healthy young men…before engaging any individual, It was ascertained that he was in sound health and has no history of diabetes mellitus in his family.” Moyer and Womack4 in 1950, utilized the most common source for normality. “…the 103 control subjects consisted of hospital personnel and other ambulatory patients hospitalized for orthopedic conditions, uncomplicated duodenal ulcer, and otorhinology disease…results of the test show that a fasting blood sugar level of 120 mg. per 100 cc. or less is normal.” Parenthetic mention should be made that these investigators utilized three different test techniques, the standard glucose tolerance, the Exton-Rose procedure, and the IV technique and reported, in their so-called healthy sample, fasting values of 96 ± 11, 98 ± 11, and 96 ± 11 mg% respectively. This point will be returned to later in this report. For the moment, it is relevant to underline the very arbitrary criteria for health. Mosenthal and Barry,5 just a few months later, described what is now one of the most recognized bases for norms. They indicated, “the present effort concerns itself solely with normal individuals. Fifty tests were carried out. The subjects were from all classes of society…only ambulant persons were used. The criteria for normality with this method are 100 mg. or less of glucose per 100 cc. blood in the fasting state.” It is obvious that the sample size is small, only an upper limit is provided and the criteria for health very arbitrary. Jackson6 (in 1952) contributes another and unique baseline group, “…for controls we took a series of…similar race and age distribution who were attending the hospital for various reasons, none of them being known diabetics.” In other words, sick people, provided they were not suffering with diabetes mellitus, were viewed as adequate controls for the study of blood sugar in healthy persons! Two years later, Fajans and Conn7 also utilized the commonly employed reference group, “glucose tolerance tests were performed in 50 control subjects without a known family history of diabetes…medical students, physicians, dietitians, and other healthy individuals, each without a known family history of diabetes, were used as control subjects.” Unger8, in 1957, set out clearly his criteria (or lack thereof), “…the control group (152 individuals) for this study was selected blindly from among negative-screening applicants for food-handler certificates at the Dallas City Department of Health whose blood sugars had ‘screened’ below 130 mg% within one and one-half hours of a meal. In other words, no attempt was made to regulate the composition of the group, other than to exclude persons with postprandial hyperglycemia.” Hagen9 followed in 1961 and put it very simply, “…28 normal women were investigated.” O’Sullivan and Mahan10 shortly thereafter sought the answer to “normal” blood sugar in pregnant women and concluded, “these screening criteria consisted of (a) a family history of diabetes, (b) birth of baby nine pounds or more, (c) a history of fetal death, neonatal death, congenital anomaly, prematurity, toxemia (excess weight gain, hypertension, proteinuria) in two or more previous pregnancies; and (d) a venous blood glucose of 130 mg. per 100 ml. or more one hour after 50 g. of glucose orally administered in the afternoon of registration.” They observed that the fasting blood glucose in 752 unselected pregnancies was 69.3 ± 10.4 mg%. In order to study norms in children, Pickens, Burkeholder and Womak11 reported in 1967 that, “..glucose tolerance tests were performed on 200 healthy children…without a family history of diabetes…the subjects of this study came from two groups…those below the age of six years were mostly recruited from students’ families in a housing development for married university students… those between the ages of six and twelve were recruited from the University of Missouri Laboratory School… pertinent historical data were obtained and a physical examination was performed on each child…children with a recent infection or chronic illness were excluded, as were children with a family history of diabetes.” Once again we observe the broad and arbitrary criteria for wellness.
Materials and Methods
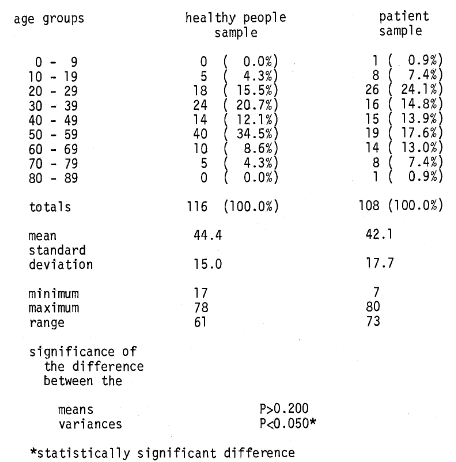
Two hundred twenty-four persons participated in this study. One group of participants consisted of 108 patients who appeared in a private outpatient medical practice for the treatment of a variety of complaints. They are referred to in this report as the “patient population.” Their age distribution is shown (Table 2).
Table 2–age distribution
Each patient completed an extensive medical history including a review of systems which consisted of 37 questions requiring a positive or negative response. The questions were so structured that a positive response could be medically significant. Each patient, after a minimum of 10 and a maximum of 14 hours fast, also underwent a comprehensive battery of biochemical tests. Included in this battery was a serum glucose determination.
The other group of participants consisted of 116 persons who were recruited through brief newspaper and television features, and by word of mouth. The criteria used were: (1) to be within 10% of ideal body weight (Metropolitan Life Insurance Tables), (2) to have not smoked cigarettes in the past three years, (3) to consume less than three ounces of alcohol per week, (4) to have an exercise program involving some form of body movement for at least 20 minutes three times per week, (5) to eat three meals per day in a regular pattern including breakfast, (6) to sleep six to eight hours daily, (7) to have not seen a physician for the purpose of treating an illness within the past 12 months, (8) to have not taken any form of medication, including antibiotics, birth control pills, or hormones for one year, or antihistamines for two weeks. This group is referred to in this report as the “healthy people population.” Their age distribution is shown (Table 2). Each healthy person completed the same medical history, including review of systems, as the patients. After a 14 hour fast, each healthy person underwent the same battery of biochemical tests as the patients.
All participants in the study were treated alike in regard to obtaining specimens for testing, including time of day, body position, and use of tourniquet. The glucose was determined on serum by a Technicon SMAC Analyzer using hexokinase methodology. The laboratory performing the test was STATLABS, Wichita, Kansas. One standard deviation for this method is 2.56 mg/dl, the coefficient of variation is 2.9%, and the reference range is 65 to 120 mg/dl.
The statistical tools employed in the evaluation of the data include Student’s t-test and the F-Distribution.12
Results
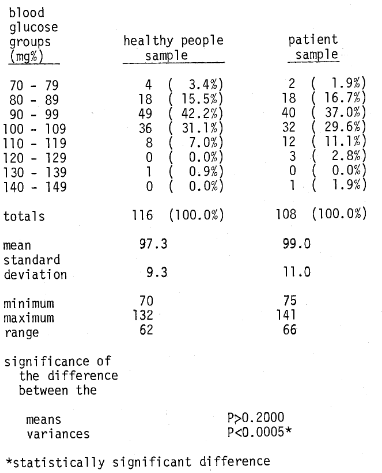
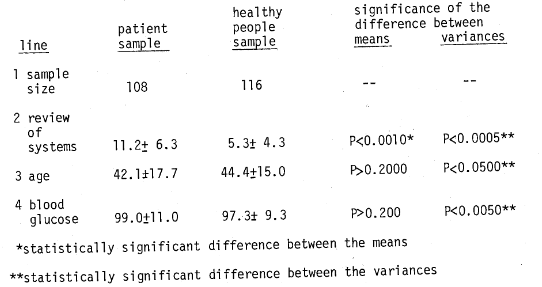
A number of points deserve special mention. First, the evidence is clear that there is no significant difference between the mean age of the patient sample (44.4) and the mean age of the healthy people sample (42.1) (Table 2). However, it is true that the range and distribution of age values is somewhat greater in the patient population (Table 2). Second, it is well to underline the responses on the review of the systems (ROS) (Table 3). Clearly, the number of patients “complaints” on the ROS are twice (11. 2 versus 5.3) that of the healthy people group. Also, the spread of ROS scores is greater in the patient category. Finally as indicated in Table 4, while the mean glucose scores are not significantly different in the two groups, the variances in the two groups are significantly different.
Table 3–review of systems distribution
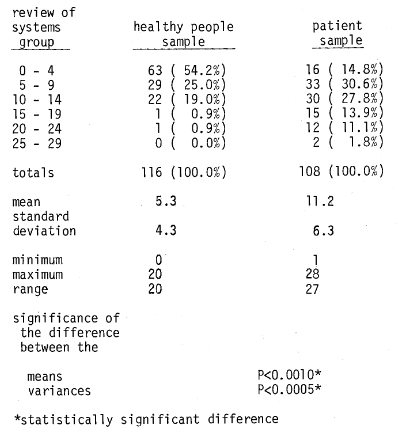
Table 4–blood glucose distribution
Discussion
Question One: Are there any differences in the values in the “patient” versus the “healthy people” samples? With regard to this question, three points can be made. First, utilizing the review of systems as a measure of clinical health (Table 5), the evidence is clear (line 2) that the number of “complaints” in the healthy people population is just about half (5.3) that observed in the patient population (11.2). The differences between the means of the two groups are statistically significant (P<0.0010) as well as the variances (P<0.0005). The point should be underlined that there is no statistically significant difference between the means (P>0.2000) with regard to age (42.1 versus 44.4 years) in the patient versus healthy people population. What is especially important is that there is no significant difference of the mean values in terms of blood glucose (99.0 versus 97.3 mg.%). However, there is a statistically significant difference of the variances (P<0.0050) as shown by 11.0 versus 9.3 mg% in the “patient” and “healthy people” samples respectively. Parenthetic mention should be made that the means for the patient group coincide with those previously reported by Moyer and Womack.4 Hence, in answer to the first question, there is an understandably clinically better state (as judged by review of systems in the people versus the patient population). Also, in the “healthy people group,” the blood glucose values cluster significantly closer to the mean.
Table 5–comparison of clinical state (as measured by review of systems) versus fasting blood glucose in a patient versus healthy people population
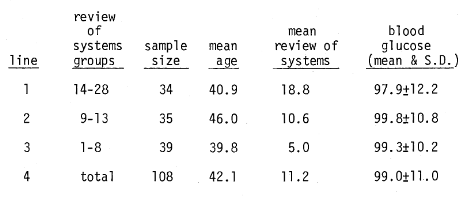
Question Two: Are glucose scores systematically related to number of symptoms within the patient group? Obviously, within the so-called patient population, some persons are more ill than others. Utilizing the review of systems as a measure of clinical health and sickness, Table 6 shows that the number of complaints for patients ranged from 1 to 28. Accordingly, we arranged the 108 patients in three near-equal groups based on clinical conditions as judged by review of systems. In line 1, there are 34 subjects with 14 to 28 signs and symptoms in the review of systems group. It will be observed that, on the average, there are 18.8 so-called complaints and the blood glucose is 97.9 ± 12.2mg%. In the second group (line 2), the review of systems are of an order of 9 to 13 with an average of 10.6 and the blood glucose is 99.8 ± 10.8. Finally, in line 3, we observe the relatively healthiest of the three groups with 1 to 8 positive responses in the review of systems, with a mean of 5.0 and a blood glucose of 99.3 ± 10.1. Two points should be emphasized. First, there is no significant difference of the blood glucose means. Second, the variance declines as one moves from line 1 to line 3 as shown by 12.2, 10.8, and 10.2 mg%. Hence, in answer to the second question, even within the patient population, those who are relatively healthier as judged by the review of systems, show a blood glucose range which clusters significantly closer to the mean.
Table 6–relationship of clinical state (as judged by review of systems) versus fasting blood glucose in a patient population
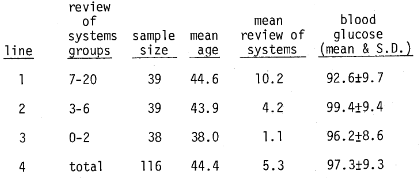
Question Three: Are glucose scores systematically related to number of symptoms within the “healthy people” sample? Table 7 provides an analysis of the “healthy people” population similar to that shown for the patient group (Table 6). Once again, even within the healthy people population, there are some who are obviously healthier than others. These have been arrayed in terms of the number of positive responses in the review of systems. Line 1 shows those who would be least healthy with 7 to 20 complaints versus line 3, the healthiest, with 0 to 2 clinical findings. It is noteworthy that, as in the case with the patient population, the difference between the mean blood glucose levels in the three groups are not significantly different. However, in perfect order, the variance declines from 9.7 (line 1), in the sickest of the healthy group to 8.6 (line 3) in the healthiest of the healthy group. Parenthetic mention should be made here that, unlike the patients, the possibility of age-dependence prevails. Hence, in answer to the third question, the trend here is essentially that previously observed in the patient population.
Table 7–relationship of clinical state (as judged by review of systems) versus fasting blood glucose in a healthy people population
Question Four: Can one draw any philosophic and practical conclusions from these subsets of data on fasting blood glucose? Table 1, developed by Murphy,1 lists seven different definitions for the word “normal” in order of increasing complexity and subjectivity. Murphy also provides alternative terms that he thinks are preferable to “normal.” It is apparent, from this table and the observations of others,13 that there are really seven different answers to the question, “What is a normal fasting blood glucose level?”
Setting aside for the moment the usual arguments that the fasting blood glucose is a function of laboratory methodology, age, sex, pregnancy state, emotional condition, dietary habits, and so on, there are two possible contributions which we think the preceding data make to this discussion of how glucose scores or norms are to be understood. First of all, the selection of the sample used to establish the current two standard deviation concept of normal is systematically affected by sample selection criteria (e.g. “healthy people”) a la Breslow and Belloc14 or miscellaneous (without a family history of diabetes). Utilizing criteria for the selection of healthy people described in this report, normal fasting blood glucose lies within a relatively narrow range (has less variance), and is much more restrictive than is generally held in traditional medical circles. The healthy people group has dramatically less variance, and the standard deviations in this sample is dramatically different than that in a more general population.
Secondly, even within a carefully selected healthy sample of people, deviation from a mathematically determined ideal score tends to be matched by an increase in signs and symptoms. One might therefore justifiably begin to think in terms of degrees of normalcy, with degrees of deviation from an ideal score having increasingly predictive strength in terms of probability of the existence of subclinical and clinical disease.
While the data shown here utilizes a refreshing and not-too popular analysis and yields possible exciting findings, it should also be pointed out that there are limitations. It would certainly be exciting to have this experiment repeated by other investigators in other environments, hopefully under more sophisticated controls and with larger number of subjects and utilizing other statistical methodology. Most importantly, it is hoped that this study will catalyze additional efforts in this area of “normality research.”
References Cited:
- Murphy, E.A. “The normal, and the perils of the sylleptic argument.” Perspect. Biol. Med. 15: 566-582, 1972.
- Hale-White, R. and Payne, W.W. “Dextrose tolerance curve in health.” Quart. J. Med. 19: 393-410, 1926.
- Himsworth. H.P. “The dietetic factor determining the glucose tolerance and sensitivity to insulin of healthy men.” Clin. Sc. 2: 67-94, 1935.
- Moyer, J.H. and Womack, C.R. “Glucose tolerance: I. A comparison of 4 types of diagnostic tests in 103 control subjects and 26 patients with diabetes.” Am. J. Med. Sci. 219: 161-173, 1950.
- Mosenthal, H.O. and Barry, E. “Criteria for an interpretation of glucose tolerance tests.” Ann. Intern. Med. 33: 1175-1194, 1950.
- Jackson, W.P.U. “Studies in prediabetes.” Brit. Med. J. 2: 690-696, 1952.
- Fajans, S.S. and Conn, J.W. “An approach to the prediction of diabetes mellitus by modification of the glucose tolerance test with cortisone.” Diabetes 3: 296-304, 1954.
- Unger, R.G. “The standard two-hour glucose tolerance test in the diagnosis of diabetes mellitus in subjects without fasting hyperglycemia.” Ann. Intern. Med. 47: 1138-1153, 1957.
- Hagen, A. “Blood sugar findings during pregnancy in normals and possible prediabetes.” Diabetes 10: 438-444, 1961.
- O’Sullivan, J.B. and Mahan, C.M. “Criteria for oral glucose tolerance test in pregnancy.” Diabetes 13: 278-285, 1964.
- Pickens, D.M., Burkeholder, J.N., and Womack, W.M. “Oral glucose tolerance test in normal children.” Diabetes 16: 11-14, 1967.
- Li, J.C.R. Statistical Influence 1. Edwards Brothers, Inc., Ann Arbor, 1965.
- Galen, R.S. “The normal range: a concept in transition.” Arch. Path. Lab. Med. 101: 561-565, 1977.
- Belloc, N.B. “Relationship of health practices and mortality.” Prevent. Med. 2: 67-81, 1973.