
Access to all articles, new health classes, discounts in our store, and more!
Predictive Medicine IX. Diet
Published in Journal of The American Geriatrics Society, Vol. 19, No. 11, 1971.
* * *
ABSTRACT: A unique feature in a predictive medicine program is the role of diet in the prediction of classical disease. Examples are given of the relationships between diet and the clinical state, the electrocardiographic P1 wave, and the biochemical state. Countless dietary interrelationships are based on the linkages between nutritional substances, metabolic reactions, and hormones.
“Our studies at Harvard among residents suggest that the average physician knows little more about nutrition than the average secretary–unless the secretary has a weight problem, and then she probably knows more than the average physician.” – Jean Mayer
According to the best available published figures, there are approximately thirty-five large multiphasic screening programs operating in the United States at present. There is considerable variation among them with regard to their purposes and, accordingly, the factors studied. However, one conspicuous common denominator is that the question of diet is not considered.
Diet and nutrition play an important role in the genesis of health and disease.1 Additionally. there is abundant evidence that a significant segment of the American public is eating poorly.2 In relation to these facts, predictive medicine is unique in that it incorporates a dietary survey.
In this ninth report of the series, we indicate the utility of dietary analysis in the anticipation of disease, many cases of which allegedly are not nutritional syndromes.
Diet and Clinical State
The literature is replete with evidence of significant relationships between various classical disease syndromes and specific nutrients.1 However, relatively little attention has been accorded the role of diet in the early stages of disease. For this reason, and only for illustrative purposes, one experiment is outlined here to show a possible correlation between a specific nutrient and the general symptoms and signs observed in a presumably healthy population.3
Two hundred and twenty-one dentists and their wives participated in a survey in which each member completed a food frequency questionnaire. By computer analysis, a printout was provided showing the daily consumption of major foodstuffs, vitamins and minerals, and comparisons with the Recommended Dietary Allowances provided by the Food and Nutrition Board of the National Research Council. For purposes of this example, only the daily vitamin-C intake is considered. Also, each participant completed the Cornell Medical Index Health Questionnaire. The number of positive responses suggesting pathosis were calculated and labelled the CMI score.
Figure 1 shows age in relation to the mean CMI scores. Additionally, the subjects were divided into two groups based upon the daily intake of ascorbic acid (vitamin C). With age, the number of pathologic responses increased. It is also evident that, in every age group, the CMI scores were higher for the subjects consuming the lesser amounts of vitamin C. It is noteworthy that the average intake of ascorbic acid, even in the more pathologic group, was well above the Recommended Dietary Allowance of 60 mg per day.
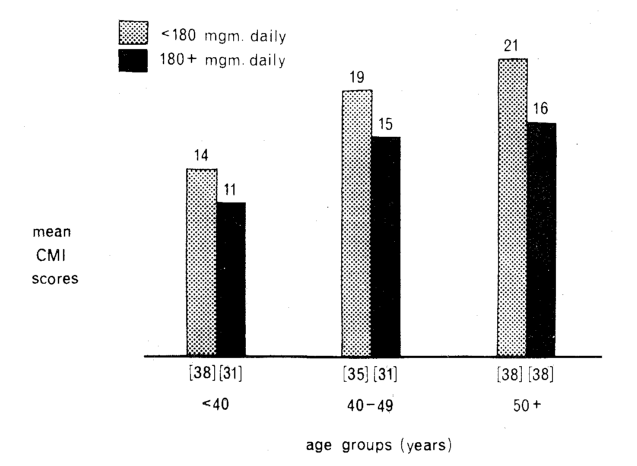
Fig. 1. The relationship of age to the number of clinical signs and symptoms (Cornell Medical Index) in terms of daily vitamin-C consumption. The signs and symptoms increased with time, but the number at each age interval was higher for those consuming less than 180 mg of vitamin C daily.
These data, supported by other similar observations, suggest a correlation between diet and the early clinical findings associated with disease.
Diet and Electrocardiography
With advancing age, electrocardiographic changes occur.4 For example, with time, the height of the P wave in Lead I increases. Whether this is a physiologic aging phenomenon or a pathologic aging process characteristic of disease in the autumnal years is still argued. However, there is mounting evidence that the higher the P1, the more pathologic the picture.
Two hundred and twenty-one presumably healthy subjects were studied in terms of daily thiamin (vitamin B1) intake and the height of the P1 wave.3 Figure 2 shows the results. The P1 wave was higher in the older age group. However, it was significantly higher in those consuming the lower amounts of vitamin B1. These findings are in agreement with those of other reports showing, for example, the height and duration of P1 in relation to blood glucose.5,6
Thus there is some evidence that diet and certain electrocardiographic findings are related.
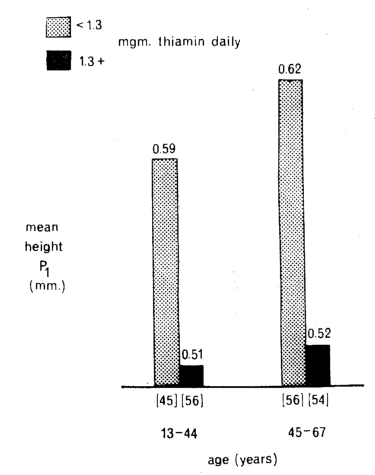
Fig. 2. The relationship of age to the height of the electrocardiographic P1 wave. Subjects consuming the lesser amounts of thiamin (vitamin B1) showed the higher P1 waves, particularly in the older age group.
Diet and the Biochemical State
Much is known about a number of nutrients and their relationship to various biochemical factors. All nutrients are interrelated through their role in the action of enzymes which regulate metabolism, and therefore are intimately related to the chemical constituents of the blood. The classic example is carbohydrate intake and the glucose tolerance test. To emphasize this point in an area not so clearly defined, Figure 3 shows the parallelisms between the daily intake of vitamin E and the level of serum cholesterol (nonfasting subjects).
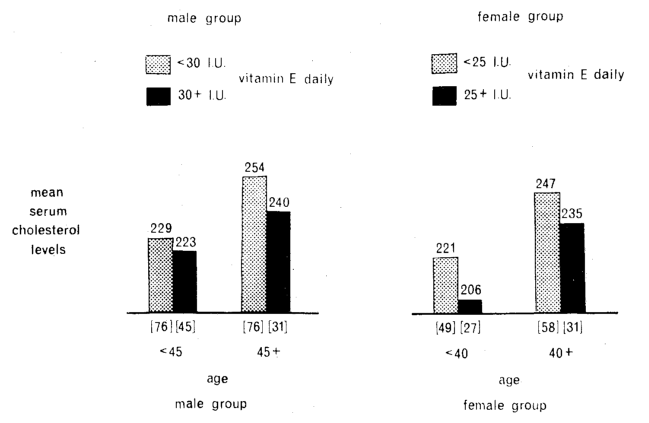
Fig. 3. The relationship of age to the nonfasting serum cholesterol concentration (mg/100 ml). For both sexes, the subjects consuming less than Recommended Dietary Allowances of vitamin E daily had the higher serum cholesterol levels.
Two hundred and twenty-eight males and 165 females, apparently healthy, were studied in terms of serum cholesterol concentration and age.3 Each group was subdivided into two groups based upon the daily intake of vitamin E. The Food and Nutrition Board of the National Research Council recommends for the male a daily vitamin-E intake of 30 i.u. As shown in Figure 3, cholesterol levels were higher in the older men than in the younger ones. However, the cholesterol levels were much higher in those consuming the smaller amounts of vitamin E (less than 30 i.u. daily). According to the Food and Nutrition Board, the recommended dietary allowance for vitamin E is 25 i.u. for the female. Figure 3 shows that, in the women, the lower vitamin-E intake paralleled the higher serum cholesterol concentration.
The foregoing is an example of the correlation between diet and the biochemical state.
Dietary Interrelationships
Persons who consume large quantities of one particular nutrient tend to consume large amounts of other nutrients. In other combinations, persons who take relatively large quantities of some nutrients tend to take relatively small amounts of other nutrients.
This concept of dietary interrelationships is shown in the following study of 129 males and 82 females.3 The daily consumptions of vitamins B1 and total protein were determined by means of a food-frequency questionnaire. Figure 4 shows the relationship between the thiamin (vitamin B1) intake and the total-protein intake. The correlation coefficients of +0.769 and +0.713 in males and females respectively were statistically significant.
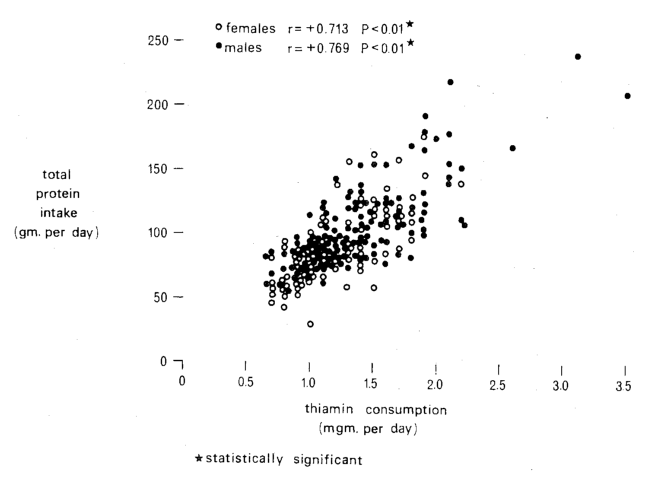
Fig. 4. The relationship of thiamin (vitamin B1) intake to total protein intake, in males and females. There were highly significant correlations for both sexes.
From these data and many others, it would seem that it is difficult to find a single dietary deficiency.
Metabolically, nutrients are interrelated as outlined in the following citation from Harte and Chow:7 “Perhaps the most striking impression received from evaluation of the literature is that hardly any study undertaken with any pair of nutrients has failed to show a significant interaction in terms of some nutritional or biochemical criterion. This is not surprising, though, since each step of the chain of reactions through which a nutrient goes as it follows an appropriate metabolic pathway is mediated by at least one enzyme system, and the functioning of every enzyme system calls for the combined action of an apoenzyme (made up for the most part of amino acids) and a coenzyme (which usually includes a vitamin and/or a mineral element).”
Nutritional substances, metabolic reactions, and hormones are linked inseparably (Fig. 5).8 What is particularly relevant is that certain nutrients can be resistance agents whereas others can be susceptibility factors.9
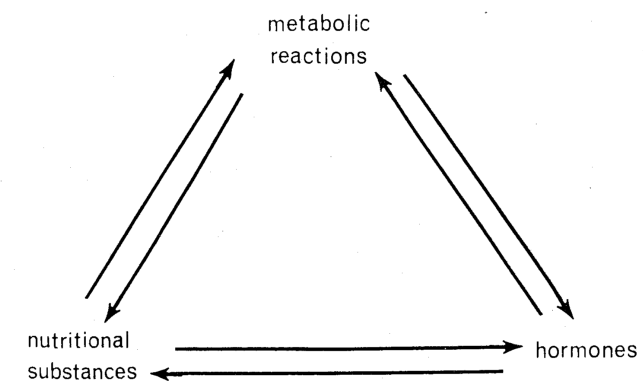
Fig. 5. Schematic representation of the interplay of nutritional factors, hormones, and metabolic reactions.
References Cited:
- Cheraskin, E.; Ringsdorf, W. M., Jr., and Clark, J. W.: Diet and Disease. Emmaus, Pennsylvania, Rodale Books, 1968.
- United States Department of Agriculture. Agricultural Research Service: Food Consumption of Households in the United States. Spring 1965. Household Food Consumption Survey, Reports 1-5. Washington, D. C., United States Government Printing Office, 1968.
- Unpublished data, Department of Oral Medicine, University of Alabama Medical Center, Birmingham, Alabama.
- Lepeschkin, E.: Modern Electrocardiography. Baltimore, The Williams and Wilkins Company, 1951.
- Cheraskin, E., and Ringsdorf, W. M., Jr.: “Electrocardiography and carbohydrate metabolism. I. P-wave length (lead I) in presumably healthy young men,” J. M. A. Alabama 38: 1011 (May) 1969.
- Cheraskin, E., and Ringsdorf, W. M., Jr.: “Electrocardiography and carbohydrate metabolism. II. P-wave height (lead I) in presumably healthy young men,” Angiology 21: 18 (Jan.) 1970.
- Harte, R. A., and Chow, B.: “Dietary interrelationships,” in Wohl, M. G., and Goodhart, R. S.: Modern Nutrition in Health and Disease (third edition). Philadelphia, Lea and Febiger, 1964.
- Dumm, M. E., and Ralli, E. P.: “The hormonal control of metabolism,” Ibid.
- Cheraskin, E., and Ringsdorf, W. M., Jr.: “Predictive medicine. III. An ecologic approach,” J. Am. Geriatrics Soc. 19: 505 (June) 1971.