
Access to all articles, new health classes, discounts in our store, and more!
What is Wrong With White Bread Vitamin E Content of Foods
Published in Journal of Nutrition, Vol. 40, January-April 1950.
* * *
Practical Nutritional Aspects of Vitamin E–Introductory Remarks
Author: Philip L. Harris.
* * *
“Practical nutritional aspects” of vitamin E implies a quantitative knowledge and a quantitative application of vitamin E in the nutrition of farm animals and of man. The 1939 Conference had no session on practical nutritional aspects because at that time the vitamin E field was still in its “qualitative phase.” Since then, foods and feeds, body-tissues and excretions have been analyzed for vitamin E. Losses of vitamin E due to food processing have been studied. Increased requirements induced by physiological stresses have been established. Also, methods for the determination of vitamin E concentration in blood have been developed and applied to a variety of metabolic studies. In effect, the “quantitative phase” of vitamin E research has been entered.
One practical outcome which has already emerged resulted from the discovery that the process of aging flour with NCl3 destroyed 80 per cent of the vitamin E.1 Because of this loss of vitamin E, chemical treatment of flour was discontinued in Germany five years ago. Another practical advance is the adoption of regulations in Canada covering the use of vitamin E in food and pharmaceuticals. The Canadian Food & Drug Division has ruled that the amount of vitamin E in a preparation labeled to contain this vitamin must furnish at least 10 I.U. in a minimum daily dose. When the amount is over 50 I.U. in a daily dose, the preparation is considered therapeutic in nature and must be so labeled.2
Consequently, it seems that the basic purpose of the papers to be presented in this section of the monograph is to evaluate critically the few data in the literature which bear on the human and animal requirement for vitamin E and to contribute new data from controlled and scientifically designed experiments which will lead us nearer to the answer of how much vitamin E each individual, animal and human, needs for optimum nutrition.
Somewhat pertinent to this problem, we attempted several years ago to extrapolate from the vitamin E needs of the rat to a value for the minimum daily requirement of humans.3 On the basis of direct proportionality to body weight, a requirement for a 70 kg. human would be 60 mg. or more of tocopherol per day. This seemed unreasonably large, so we then tried to relate requirement to quantity of food ingested. Here, however, the value arrived at for humans was only about 12 mg. of tocopherol daily. Thus, although one value seemed much too high and the other much too low, we used the range 12 to 60 mg. of natural tocopherols as the limits within which the daily requirement for vitamin E probably falls.
Recently, Brody, of the University of Missouri, has presented a great deal of evidence showing that various functions and reactions of the body are related not to body weight but to the 0.7 power of body weight.4 This function of body weight (weight0.7) has been designated “physiological weight,” in contrast to weight,1.0 which is “physical” or “gravitational” weight. Basal energy metabolism, endogenous nitrogen excretion, milk energy production, egg energy production, and many related processes all vary as the 0.7 power of body weight. Consequently, we wondered if vitamin E requirement also varied with physiological, instead of physical, body weight.
We therefore collected the data shown in Figure 1, which relates the log. of vitamin E requirement of animal species, where this can be calculated, to the log. of body weight. The straight line which best fits the points in Figure 1 has a slope of 0.73, not significantly different from Brody’s value of 0.7. This means that for every 100 per cent increase in body weight, vitamin E requirement would be increased by 70 to 73 per cent. For a 70-kilogram human, the value is approximately 30 I.U. of vitamin E per day.
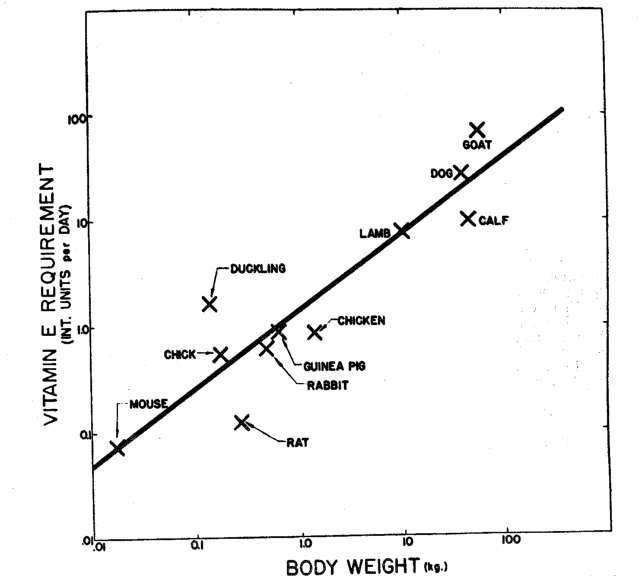
Figure 1. Showing the relationship between vitamin E requirement of various species of animal and body weight. The line which best fits the data points has a slope of 0.73 indicating that vitamin E requirement varies with Wt. 0.73. The points from which the straight line was established were obtained by evaluating data reported in the literature for mice,4,6 rats,6,7,8,9,10 chicks,11,12,13 ducklings,14 guinea pigs,15 chickens,16 lambs,17 dogs,18 calves,19 rabbits,20,21,22 and goats.22,24
These relationships, vitamin E requirement as a function of physiological weight and the estimated human requirement for this vitamin, are presented merely as working hypotheses to be modified, replaced, or confirmed. The papers which follow will contribute data relative not only to these hypotheses but to a variety of other quantitative aspects of the practical use of vitamin E in nutrition.
References Cited:
- Kuhn, R. 1945. CIOS. Item No. 24, File No. XXIV-13. H. M. Stationery Office, London.
- Trade Inf. Letter No. 8. Feb. 22, 1949. Dept. of Nat’l. Health & Welfare, Ottawa, Canada.
- Hickman, K. C. D. & P. L. Harris. 1946. Advances in Enzymology. 6: 469-524. Interscience. New York.
- Brody, S. 1945. Bioenergetics and Growth. Reinhold. New York.
- Mason, K. E. 1940. Am. J. Physiology 131: 263.
- Goettsch, M. J. 1941. Nutrition 23: 513.
- Mason, K. E. 1940. Am. J. Physiology 131: 268.
- Evans, H. M. 1943. J. Nutrition 26: 555.
- Goettsch, M. & A. M. Pappenheimer. 1941. J. Nutrition 22: 463.
- Moore, T. 1940. Biochem. J. 34: 1321.
- Patrick, H. & C. L. Morgan. 1944. Poultry Sci. 23: 525.
- Dam, H. 1944. J. Nutrition 27: 193.
- Pappenheimer, A. M., M. Goettsch, & E. Jungherr. 1939. Conn. Agri. Exptl. Sta. Bull. 229:1.
- Pappenheimer, A. M. 1940. Proc. Soc. Exptl. Biol. & Med. 45: 457.
- Shimotori, N., G. A. Emerson, & H. M. Evans. 1939. Science 90: 89.
- Dju, M. Y. Unpublished data.
- Willman, J. P., J. K. Loosli, S. A. Asdell, F. B. Morrison, & P. Olafson. 1945. J. Animal Sci. 4: 128. Also, personal communication.
- Elvehjem, C. A. 1944. J. Pediatrics 24: 436.
- Parrish, D. B., G. H. Wise, & J. S. Hughes. 1947. J. Dairy Sci. 30: 849.
- Hove, E. L. 1947. J. Nutrition 33: 95.
- Mackenzie, C. G. & E. V. McCollum. 1940. J. Nutrition 19: 345.
- Eppstein, S. H. & S. Morgulis. 1941. J. Nutrition 22: 415; 1942. Ibid. 23: 473..
- Madsen, L. L., C. M. Mccay, &. L. A. Maynard. 1933. Proc. Soc. Exptl. Biol. & Med. 30: 1434.
- Spencer, D. A. 1939. Food & Life. U. S. Printing Office House Doc. 28: 758-62.
Vitamin E Content of Foods
Authors: Philip L. Harris, Mary L. Quaife, and William J. Swanson.
* * *
Information regarding the vitamin E content of a variety of American foods has not been available. Consequently, we are presenting results obtained in our laboratory in the past 4 years, during which time we have analyzed commonly used foods for total tocopherols and for ⍺-tocopherol, utilizing chemical procedures recently described (Quaife and Harris, ’48). Incidentally, using these new values for vitamin E in foods, we have made an estimate of the average per capita consumption of total tocopherols and of ⍺-tocopherol in the United States.
Method
The foods in this survey were purchased on the open market in Rochester, New York. Except for bakery products, they were analyzed in their raw state, following such treatment as would be given them in the home prior to cooking, i.e., washing, peeling, and removal of inedible portions.
The chemical procedures used for determining total tocopherols and γ plus ẟ-tocopherols in plant and animal tissues have been described in detail by Quaife and coworkers (’48, ’49). The difference between total and γ plus ẟ-tocopherol values was used as the measure of ⍺-tocopherol content except in wheat products, where ẞ-tocopherol is known to occur. Values reported are the means of quadruplicate analyses.
Results
Fruits
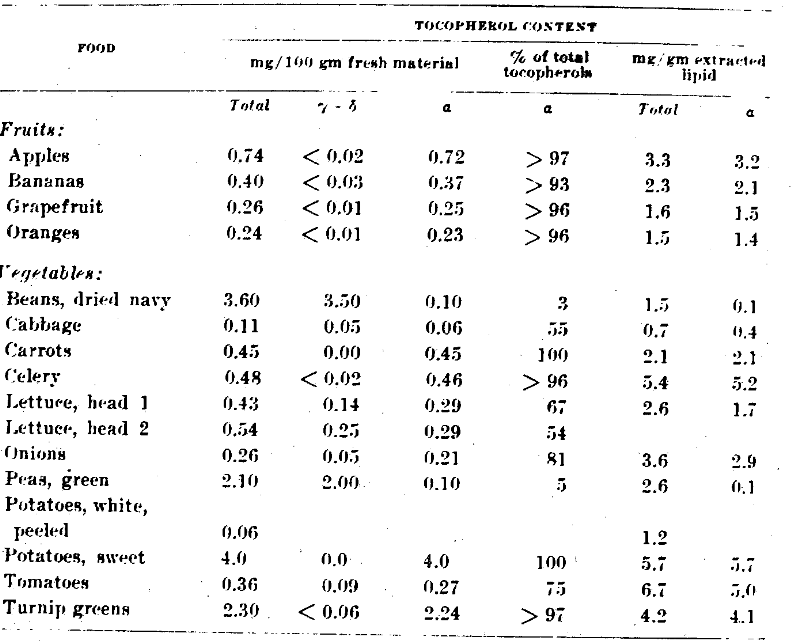
It is interesting to note (table 1) that essentially all of the vitamin E in those fruits tested occurs as ⍺-tocopherol. Practically no γ- or ẟ-tocopherol was found. However, the quantity of ⍺-tocopherol in an average serving of these fruits is quite low, 0.23 to 0.72 mg, and this category of foods must be rated as a rather poor source of vitamin E.
Table 1–Tocopherol content of fruits and vegetables
Vegetables
In generalizing about the total tocopherol content of the vegetables shown in table 1, one would consider that they are better sources of vitamin E than fruits, since they range in concentration up to 2.30 mg per 100 gm for turnip greens and 3.60 mg for dried navy beans. However, with regard to their ⍺-tocopherol content, most vegetables fall in the range from 0.06 to 0.45 mg per 100 gm, and are thus similar to fruits as sources of vitamin E activity. An exception is turnip greens, which appear to be an excellent vegetable source of vitamin E, with 2.24 mg of ⍺-tocopherol per 100 gm.
The tocopherols of certain vegetables–turnip greens, carrots, and celery–are almost 100% in the ⍺-form. The tocopherols in legumes, navy beans and peas, contain practically no ⍺-tocopherol, while in other vegetables ⍺-tocopherol represents from 50 to 80% of the total tocopherols.
It is interesting to note that the ⍺-tocopherol content of the present samples of celery, sweet potatoes, and tomatoes, when expressed on the basis of lipid content, is surprisingly high. Thus many vegetable oils may be considerably richer in vitamin E content than wheat germ oil.
Emmerie and Engel (’43) reported essentially the same range of values for vegetables in Holland as that shown in table 1. Their samples of carrots and celery, however, were three to 4 times richer in total tocopherols. In addition, they found kale with 8.0 mg and parsley with 5.5 mg of total tocopherol per 100 gm to be among the richest vegetable sources of tocopherol.
Potatoes, both in Holland and in this country, are low in vitamin E potency. Emmerie and Engel’s value of 0.1 mg and the value in table 1 of 0.06 mg of total tocopherols per 100 gm establish this widely used vegetable as a poor source of vitamin E.
Cereals and Bakery Products
The foods in this classification are generally considered the richest sources of vitamin E in man’s diet. And it is evident from table 2 that the ⍺-tocopherol content of whole grain cereals is relatively high, ranging from 0.84 mg per 100 gm for corn to 1.94 mg for oats. East Indian unpolished rice (Engel and deVries, ’46) and Dutch oatmeal, barley and rye (Emmerie and Engel, ’43) are probably also in this range, judging from their high total tocopherol values.
The tocopherols of oatmeal are almost all ⍺-tocopherol, whereas in most other cereals only about half the tocopherols are in the form. However, it was practically impossible to analyze wheat and wheat products for non-⍺-tocopherol content because of an anomalous color reaction which they give with diazotization reagents. Consequently only total tocopherol values are reported for wheat products, although from bioassay data we estimate that about 50 to 60% of the tocopherols present are in the ⍺- form.
The very great loss of vitamin E due to the processing of cereals is illustrated in table 2 by the tocopherol values of rice and wheat. The consumer of polished rice obtains only about one-quarter of the vitamin E that he would from brown, unpolished rice. Engel (’46) reports a similar value, one-sixth, as a measure of the vitamin E retained in rice after polishing. Whole wheat flour loses about half its total tocopherol content when milled to white flour such as was used (80% extraction) in wartime in this country. If comparison were made between white and whole wheat breads using the tocopherol values reported in table 2, it would be concluded that whole wheat bread supplies a much more significant portion of the total daily intake of vitamin E. Assuming a daily consumption of 200 gm (8 slices) of bread, the use of white bread would supply only 0.46 mg of tocopherols, whereas whole wheat bread would furnish 2.60 mg.
Similar conditions exist in Holland. Both wheat and rye flour (80% extraction) possess only one-half to one-third the vitamin E of the whole grain from which they were milled. Furthermore, the bleaching of flour with NCl32 and benzoyl peroxide destroys as much as 70% of the remaining vitamin E in wheat, rye, and barley flour (Engel, ’42).
Table 2–Tocopherol content of cereal and bakery products
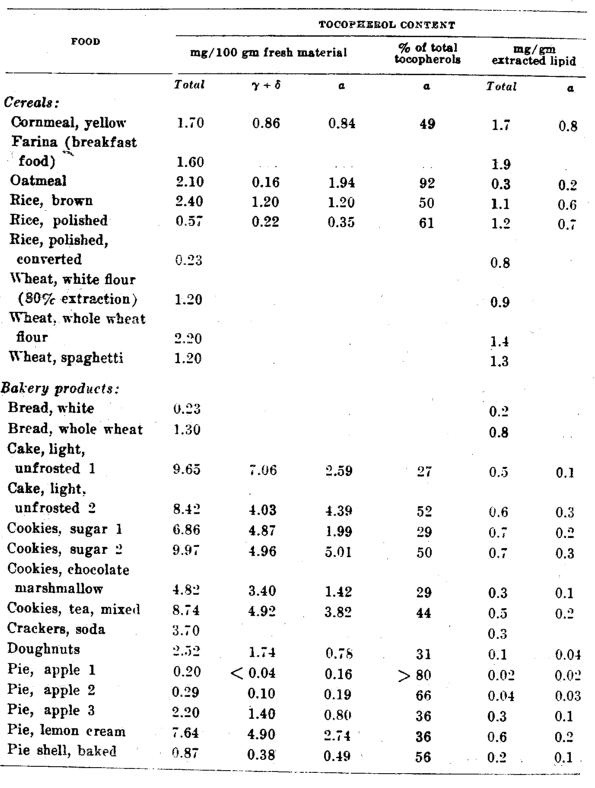
The vitamin E content of bakery products varies both because of variable losses due to the cooking process used and because of the type of ingredients used in the recipe. All of the cakes, cookies and pies listed in table 2 were commercial bakery products obtained from grocery stores and bakeries, and no information was available concerning their composition. It is evident from the tocopherol content of these products, expressed on a fat basis (0.02 to 0.74 mg tocopherols/gm of fat), that lard, vegetable shortenings, and mixtures of animal and vegetable fats could have been and probably were used as ingredients. The destruction of vitamin E by the baking process is probably relatively slight although the extent of destruction cannot be ascertained from these data.
However, deep-fat cooking can destroy considerable vitamin E, as is exemplified by our results obtained with doughnuts. Samples of both doughnuts and cooking fat were obtained from a small commercial doughnut bakery where baking operations were typical of this industry. The shortening used as an ingredient in the doughnut recipe and to refill the cooking vat was a good quality, partially hydrogenated vegetable oil containing 92.8 mg of tocopherols per 100 gm. At the start of the day’s cooking operation, this shortening was added to the fat remaining in the cooking vat from the previous day’s baking. A sample of this mixture contained 19.4 mg of tocopherols per 100 gm. The fat from doughnuts in the first batch cooked showed a tocopherol concentration of only 12.1 mg/100 gm. At the end of the day a sample of fat from the cooking vat had a tocopherol content of 10.7 mg/100 gm, and the fat from doughnuts baked in the last batch contained 6.8 mg/100 gm. The extent of the loss of tocopherol due to deep-fat cooking is not merely from 19.4 mg%, the potency of the fat in the cooking vat, to 6 to 12 mg, the fat in the cooked doughnuts, but must be measured from a value somewhere between 19.4 mg% and 92.8 mg%, the concentration of tocopherol in the shortening used in the doughnut dough.
Meats, Fish, Poultry and Dairy Products
It is evident from an examination of table 3 that foods in this category are relatively poor sources of vitamin E, with the exception of eggs. Two eggs will supply 2.4 mg of tocopherol, about 60% of which is ⍺-tocopherol.
The low tocopherol content of animal tissues may reflect loss during and after processing, since many fresh animal tissues obtained from animals on diets containing a minimum of vitamin E have shown a tocopherol content as high as 10 times the values in table 3. Stored tissues oxidize quickly and lose vitamin E, even though stored at low temperatures (Chipault, Lundberg and Burr, ’45; Quaife and Dju, ’49). The low tocopherol values in this category are probably also due to the low dietary intake of the animals, since the vitamin E content of eggs, and of the other animal products too, has been shown to be dependent upon the level of vitamin E in the feed of the chicken, turkey, pig, and rabbit (Chipault, Lundberg and Burr, ’45; Major and Watts, ’48). When the level of vitamin E feeding is low, seasonally or by locality, the food products from the animals will be correspondingly low, and vice versa.
Table 3–Tocopherol content of meats, fish, poultry and dairy products
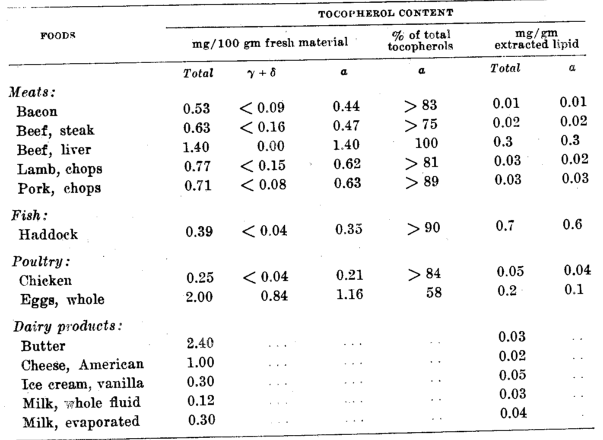
The relatively high value for the vitamin E content of fat from haddock, as shown in table 3 and in Jansen and Kringstad’s report (’42) that sardines have 4.5 mg tocopherol/100 gm (0.45 mg/gm of fat), suggests that fish may be a rich source of this vitamin. However, except for sardines and cod roe, other fish are reported (Jansen and Kringstad, ’42; Kringstad and Folkvord, ’49) to be lower in tocopherol content and, in general, in the same range as mammalian meats and poultry; e.g., salmon and mackerel 1.6 to 1.8 mg%, and herring 0.5 mg%.
Abderhalden (’47) reported an average concentration of 0.06 mg% of tocopherols in cows’ milk, with a range of from 0.02 to 0.10 mg%. Milk in the Netherlands has been reported to contain 0.02 mg of tocopherol per 100 gm (Emmerie and Engel, ’43). The value in table 3 of 0.12 mg per 100 gm is higher than those reported abroad and is explained on the basis of probable differences in the tocopherol level in the feed of the cows, although differences in the analytical procedures used may provide a partial explanation. In general, however, it may be concluded that cows’ milk is a relatively poor source of vitamin E. One quart of milk would furnish only about 0.5 mg of tocopherol.
The processing of milk to make cheese, butter, or evaporated milk apparently does not destroy vitamin E. The tocopherol content of these products is similar to that of milk when expressed on a comparable basis (table 3) 0.02 to 0.04 mg of tocopherols per gram of fat.
Oils and Fats
An examination of table 4 reveals a remarkable difference in the vitamin E content of fats and oils of vegetable origin compared with those of animal origin. The former with few exceptions are rather good sources of vitamin E, while animal fats are uniformly quite poor sources. Several oils–coconut, olive, and sesame–have relatively low concentrations of tocopherol, 3 to 18 mg per 100 gm, compared with other vegetable oils, but nevertheless they are still superior to butter and lard with respect to vitamin E.
Table 4–Tocopherol content of oils and fats
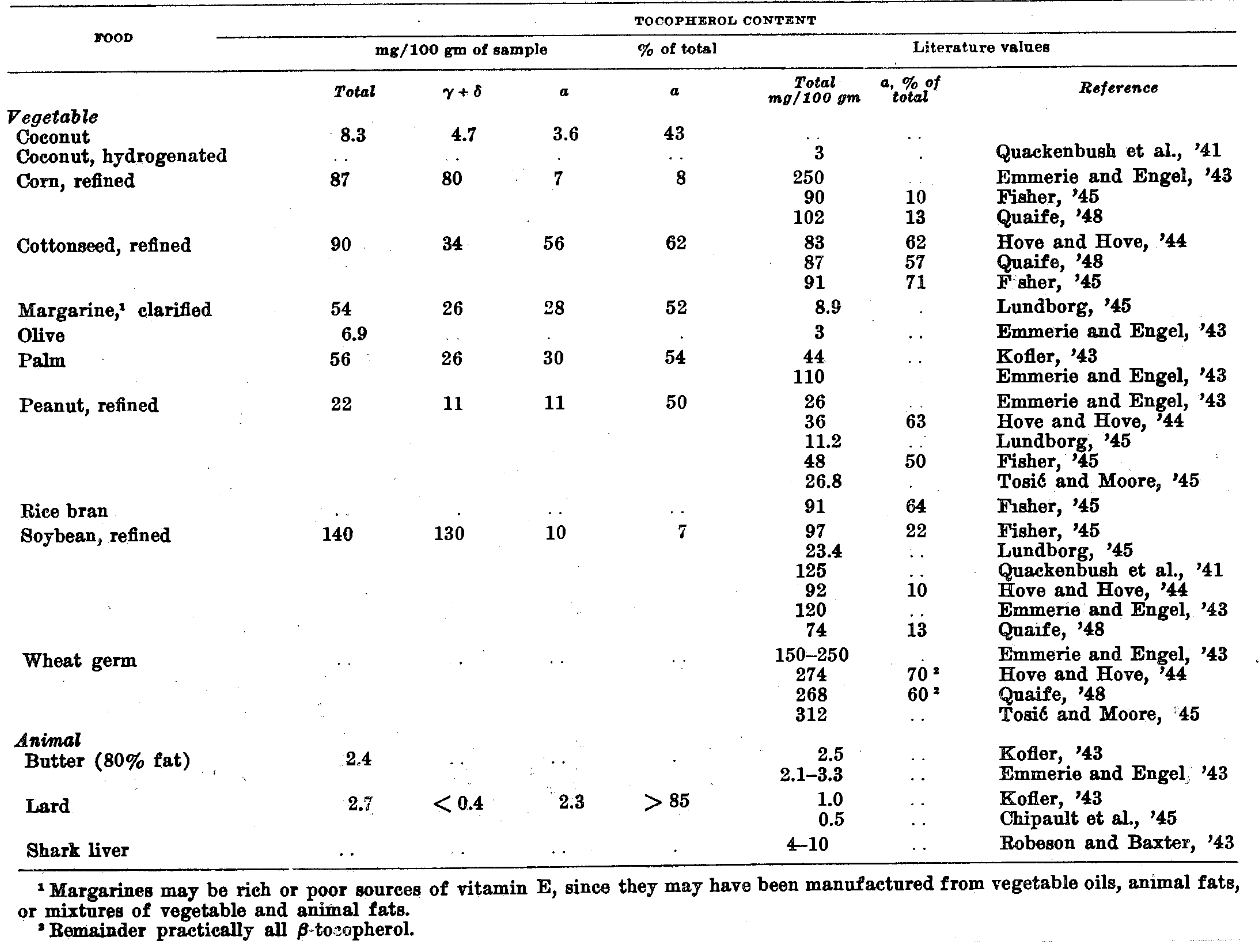
Soybean oil, as is characteristic of leguminous seed oils, and corn oil have only about 10% of their total tocopherols as ⍺-tocopherol, whereas cottonseed, peanut, rice bran and wheat germ oils have from 55 to 70% of their total vitamin E as ⍺-tocopherol. The samples of margarine tested apparently were manufactured largely from vegetable oils, judging by the relatively high concentration of total tocopherols. Also, because of the low value found for the ratio of ⍺- to total tocopherol, these oils were probably soy or corn oils, or both.
Miscellaneous
A knowledge of the concentration of tocopherol in the miscellaneous list of foods in table 5 is helpful in making dietary analyses for vitamin E. Chocolate is the only food on the list especially rich in this vitamin. Chocolate as candy bars, which sometimes make up as much as 10% of the caloric content of diets (McCay et al., ’45), would supply an appreciable and probably significant quantity of ⍺-tocopherol to the consumer.
Table 5–Tocopherol content of miscellaneous foods
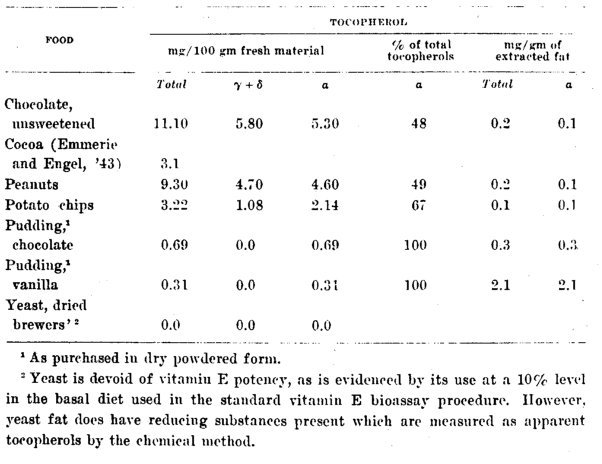
The high value for peanuts (table 5), 9.3 mg of tocopherols per 100 gm, of which about 50% is ⍺-tocopherol, establishes it as an excellent food source of vitamin E and arouses interest in the vitamin E content of other nuts. Lundborg (’45) found 11.2 mg of total tocopherol per 100 gm of peanuts, and Emmerie and Engel (’43) report high tocopherol values for beechnut and palm oils, indicating that the original nuts were probably rich sources of vitamin E.
Discussion
With values available for the vitamin E content of foods, it is a temptation to evaluate various standard diets to obtain an estimate of the human daily intake of this vitamin, or more significantly, of ⍺-tocopherol. Hickman and Harris (’46) have already speculated that the daily dietary intake for individuals may range between 1.5 and 44 mg of d, ⍺-tocopherol (3 to 88 mg of mixed natural tocopherols), depending upon socio-economic status. In Holland, Engel (’46) calculated that an average of 15.7 mg (a range of from 10.7 to 23.9 mg) of total tocopherols were consumed daily. This amounts to about 8 mg of d, ⍺-tocopherol, assuming that approximately 50% of the natural mixed tocopherols in foods are in the form. Quaife, Swanson, Dju and Harris (’49) reported an estimated daily intake of ⍺-tocopherol of from 4 to 9 mg for individuals on reducing, low-sodium, or diabetic-type diets, or those receiving only the basic foods recommended by the National Research Council. For individuals on a “fattening” diet, an intake of from 10 to 27 mg of ⍺-tocopherol was estimated.
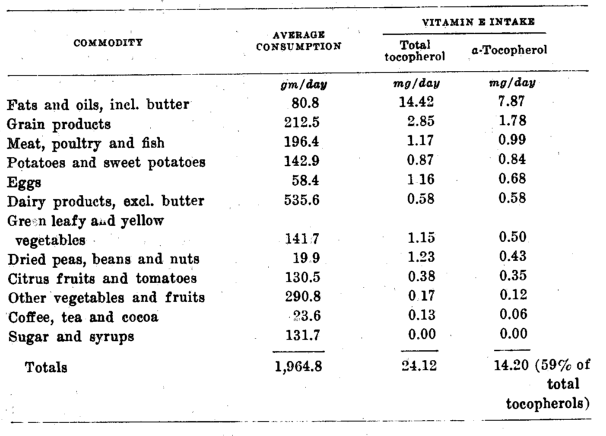
A slightly different approach to an estimation of per capita food consumption may be made from data compiled by the United States Department of Agriculture (’44). The sum total of all of the foods sold commercially in the United States, divided by the population, gives values for each of the foods which, if used as consumption values, must be accepted as maximum. This is true because much of the foodstuff sold is not actually consumed but is lost during transportation or display in retail stores, or wasted during preparation and cooking. Nevertheless, the average individual food consumption calculated in this way would furnish about 19 mg (17.5 I. U.) of ⍺-tocopherol daily. Thus, this value would seem to be the maximum obtainable by the average American. More recent government values for average per capita food consumption (U. S. Dept. of Agriculture, ’49) indicate that 14 mg (13 I.U.) of ⍺-tocopherol is a more likely value for the mean daily intake of vitamin E, since it is based on directly measured per capita food consumption as shown in table 6.
Table 6–Vitamin E content of the average daily per capita food consumption in the U.S. in 1948 (U.S.D.A., ’49)
Summary and Conclusions
Commonly used foods, typified by those available in Rochester, N. Y., have been chemically analyzed for their total tocopherol and ⍺-tocopherol content.
On the basis of the results obtained, the average per capita consumption of vitamin E in the United States has been estimated as 14 mg of d, ⍺-tocopherol (13 I.U.) daily.
The richest dietary sources of vitamin E are certain of the vegetable oils. Cereal products and eggs are next in order of nutritional importance. Vegetables supply very little of the daily intake of vitamin E, both because of their low concentration of total tocopherols and because in most instances a large portion of the tocopherols present are the relatively inactive, non-⍺-tocopherols. Animal products, similarly, are rather poor sources of vitamin E because of their quite low and variable concentration of total tocopherols, practically all of which, however, is ⍺-tocopherol.
The tocopherol concentration in animal products is probably directly proportional to the level of vitamin E in the diet of the animals from which they come and, inversely, to the severity of processing and length of storage to which they are subjected.
The value of cereal products as a source of vitamin E certainly depends upon the extent and severity of the milling process which they undergo prior to consumption.
References Cited:
- Abderhalden, R. 1947. “Vitamin E content of human and cow’s milk.” Biochem. Zschr., 318: 47.
- Chipault, J. R., W. O. Lundberg and G. O. Burr. 1945. “Chemical determination of tocopherol in animal fats.” Arch. Biochem., 8: 321.
- Emmerie, A. and C. Engel. 1943. “The tocopherol (vitamin E) content of foods and its chemical determination.” Zschr. Vitaminforsch. 13: 259.
- Engel, C. 1942. “Vitamin E content of milling products from wheat, rye, and barley and the influence of bleaching.” Ibid., 12: 220.
- —-1946. “The vitamin E (tocopherol) content of our diet and its meaning in human nutrition.” Voeding, 7: 186.
- Engel, C., and A. M. de Vries. 1946. “The tocopherol (vitamin E) content of different foods from the Dutch East Indies.” Zschr. Vitamin Forsch., 18: 89.
- Fisher, G. S. 1945. “Determination of γ-tocopherol in vegetable oils.” Ind. Eng. Chem., Anal. Ed., 17: 224.
- Hickman, K. C. D., and P. L. Harris. 1946. “Tocopherol interrelationships.” Advances in Enzymology, 6: 469, Interscience Publishers, Inc., New York.
- Hove, E. L., and Z. Hove. 1944. “Chemical estimation of a-tocopherol and total tocopherol in mixtures of the 𝛼-, β-, and γ- forms.” J. Biol. Chem., 156: 601.
- Jansen, E., and H. Kringstad. 1942. “Colorimetric tocopherol determinations.” Nord. Med., 15: 2033.
- Kofler, M. 1943. “Fluorometric determination of tocopherol. II. Determination in serum, milk, animal and vegetable fats.” Helvet. chem. acta, 26: 2166.
- Kringstad, H., and S. Folkvord. 1949. “Nutritive value of cod roe and cod liver.” J. Nutrition, 38: 489.
- Lundborg, N. 1945. “Determination of tocopherols in natural fats and oils.” Arkiv. Kemi., Mineral., Geol., A-21 (2): 1-13.
- Major, R., and B. M. Watts. 1948. “The relation of fed and injected tocopherols to development of rancidity in the stored meat and utilization of carotene by the rabbit.” J. Nutrition, 35: 103.
- McCay, C.M., M. B. Pine, F. H. Davis, R. A. Gortner, G. E. Hauger, J. H. Sullivan, L. J. Bernatowicz and B. L. Hudson. 1945. “Nutritive value of foods served in Navy messes.” J. Am. Diet. Assn., 21: 88.
- Quackenbush, F. W., H. L. Gottlieb and H. Steenbock. 1941. “Distillation of tocopherols from soybean oil.” Ind. Eng. Chem., 33: 1276.
- Quaife, M. L. 1948. “Nitrosotocopherols; their use in the chemical assay of the individual tocopherols in a mixture of the 𝛼, ꞵ, γ, and ẟ- forms.” J. Biol. Chem., 175: 605.
- Quaife, M. L., and M. Y. Dju. 1949. “Chemical estimation of vitamin E in tissue and the tocopherol content of some normal human tissues.” Ibid., 180: 263.
- Quaife, M. L., W. J. Swanson, M. Y. Dju and P. L. Harris. 1949. “Vitamin E in foods and tissues.” Annals of the New York Academy of Sciences, 52: 300.
- Quaife, M. L., and P. L. Harris. 1948. “Chemical assay of foods for vitamin E content.” Anal. Chem., 20: 1221.
- Robeson, C. D., and J. G. Baxter. 1943. “Alpha tocopherol. A natural antioxidant in a fish liver oil.” J. Am. Chem. Soc., 65: 940.
- Tosic, J., and T. Moore. 1945. “Chemical estimation of vitamin E in vegetable oils.” Biochem. J., 39: 498.
- U. S. Dept. of Agriculture, War Food Administration. 1944. “Food consumption levels in the U. S., Canada and the United Kingdom.” Second Report. Rep. 685.
- U. S. Dept. of Agriculture. 1949. “Consumption of food in the U. S., 1909-48.” Misc. Publ. 691.
Chemical Additives in Food
Author: Paul B. Dunbar.
* * *
As Dr. Dunbar Retires, After Forty-four Years in the Public Service, He Points Out Four Important Tasks Which the Food Industry Should Undertake Without Delay
More than twenty years ago, a very wise and farsighted man in the food industry expressed to me concern about the possibility that food manufacturers would become obsessed with the growing American interest in health foods and health fads to the point that they would be tempted to turn their wholesome and palatable food products into something closely approaching “patent medicines.” It was his conviction that the future of his industry lay in the improvement of methods of packing foods to retain all their finest natural qualities. He felt that the product of his industry should not be made to appeal exclusively to the invalid class but should appeal to the population as a whole, because it was a first-class food.
Today as Yesterday
That man was the late Frank E. Gorrell, secretary of the National Canners Association; a man who was responsible for organizing one of the greatest food industries in the United States. Mr. Gorrell asked me to address the National Canners Association at its Chicago meeting in January, 1930, and discuss this subject under the title “Government Attitude on Health Claims for Foods.” In preparing this discussion, I looked up that paper. A great deal of it could be read today with considerable timeliness–these sentences, for example:
“The American public today has an obsession on the question of health–health foods, health fads, health exercises. In the lingo of the day, the public is ‘health conscious’.”
Referring to the increasing knowledge of vitamins and food accessories, the paper read:
“It is not surprising that a subject so closely associated with the public health has appealed immensely to the public fancy. The public is only too prone to believe what it wants to believe. In its ignorance of the present limitations of scientific knowledge it has been disposed to accept without reservation the most extreme, and in some cases ridiculous, claims for the wholesomeness and health-giving qualities of various products.”
Carrying out my promise to Mr. Gorrell, I referred to the disposition displayed by manufacturers of certain food commodities to attempt the attainment of a perfected food by the addition, in more or less arbitrary fashion, of some of those ingredients which investigators tell us are essential to a balanced ration. The paper recognized that some of these additions are highly desirable, but the view was expressed that “in a nation like the United States, with an extremely varied and nutritious food supply available in almost all sections and at all times of the year, with ample sunshine and fresh air, wholesome water supplies, and abundant and pure milk, it is hard to believe that the average consumer has arrived at the point where it is necessary to doctor his food supply.” I have not changed the view expressed in that last quotation.
Nutritionists v. “Crackpots”
Now what are the events that have led up to passage of the House resolution authorizing the Delaney Committee investigation, and what significant things have been brought out by that investigation? First, as my quotations from the paper of twenty years ago reveal, there isn’t anything novel about the situation. As far back as any of us can remember, we have had nutrition zealots among us, many of them sincere, many of them with something to sell, many of them just plain crackpots. But they all acquired a following.
Along with the cranks and nostrum vendors there were sincere and competent nutritionists who clearly perceived that there were some nutrition areas that needed attention. The first that comes to mind is the area in which research led up to the incorporation of vitamin D in milk. We are all agreed that that was a sound and necessary nutritional advance. It was truly an example of chemical addition to food. Certainly it was in the public interest. I know of no one who contends that that type of chemical additive is objectionable. Another development, equally meritorious, which followed soon thereafter, was the program for the enrichment with necessary vitamins and minerals of flour and other cereal products. This was another example of chemical additives in the public interest.
Deceit of Layman
It is unfortunate, however, that in their justified zeal for encouraging worth-while improvements in the food supply, some nutritionists have oversold the lay public on the idea that the food of the nation has seriously deteriorated in nutritive value. This representation provided an excellent background for those food faddists or cultists who had something to sell. By adroit use of perfectly valid scientific quotations they could impress on the public (by that time readily reached by radio) that the nation was on the verge of nutritional disaster and that its only salvation was to adopt the particular remedy they had to offer.
It was but a short step from there to the development of the idea that the food industry is deliberately debasing the food supply by excessive refinement, and then to the next step–that our soil is being depleted by the misuse of fertilizers, so that the foods grown on it are no longer of optimum nutritional quality.
Serious concern among members of Congress about the whole nutrition situation was responsible for the resolution establishing the Delaney Committee. That able committee has given long and serious consideration to the whole question. It has collected a vast amount of extremely important evidence. It has also had to listen to the views of some very earnest individuals who, notwithstanding the seriousness of their contentions, seem to be completely out of step with the best scientific knowledge obtainable.
Examples of Misunderstanding
A gentleman came to my office recently, urging the dismissal of the Chief of our Division of Nutrition because he had had the temerity to testify that, in his judgment, the country was not suffering from national malnutrition because of the widespread absence of trace elements in the soil. This gentleman sincerely believed that the country would be on the verge of disaster if our entire fertilizer scheme was not revised to incorporate these trace elements in the fertilizers used throughout the nation. The alternative to this, so he said, was to rely on mixtures of vitamins and minerals which would tide us over until agriculture reaches a period of sanity. He deplored the fact that the Food and Drug Administration was making criminals of these saviors of the nation by bringing prosecutions against distributors of these lifesaving mixtures.
Typical of the scare technique being used is the campaign of one broadcaster in the metropolitan area of New York. His thesis is that through ultra refinement in manufacture and through soil starvation, our food supply has reached a point where it can no longer maintain national health and strength. Specifically, he charges that the Food and Drug Administration, by proposing to define white bread, has put a top ceiling on nutritive qualities. One means of salvation is to buy the product put out by one of the broadcaster’s clients, which, because it has not been standardized by the Food and Drug Administration (according to the broadcaster), does contain soy flour and the other elements necessary to nutritional salvation.
This kind of advertising propaganda must not be regarded as unimportant. According to the criteria employed by the broadcasting companies and the many protesting letters we have received, a large number of persons have listened to the broadcasts and have been impressed with the seriousness of the menace hanging over our nation through–let us put it bluntly–the lack of integrity of the Food and Drug Administration and the food industry.
Consumer Concern
Here are some things that appear obvious to me:
First, the entire American public is vitally concerned about the purity of its food supply: it wants freedom from positively or potentially harmful substances and it is concerned about deficiencies in what it believes to be essential nutritional ingredients.
Second, a growing proportion of consumers, egged on by food faddists who are masters in the use of the scare technique and the use of accurate scientific information to further a false conclusion, believes that the food industry is interested solely in profit, is brutally reducing the nutrition standards of the people, and is permitted to do so by the connivance or inaction of the government. This is shown by the large and growing number of protesting letters we are receiving from consumers and by the consumer acceptance of products promoted by nutrition quacks. Actually, our law-enforcement activities are becoming more and more involved with products whose labeling is based on quackery.
Third, a growing number of consumers seems to believe that not only are food products being debased by over-refinement, but also that dangerous chemicals are being added to them with a callous disregard for human health. Part of this apprehension is undoubtedly due to the publication of partial reports of the testimony presented to the Delaney Committee: testimony which accurately stated that many hundreds of different types of chemicals have been suggested from time to time for use in foods. This has been interpreted by the careless reader as meaning that this number of poisonous chemicals is being employed. There are, of course, some authentic cases where dangerous substances have been employed by manufacturers after very cursory efforts to learn in advance whether they are safe. The food industry, in general, is aware of its obligation and takes adequate precautions to undertake suitable toxicological studies before using any chemical substance in food. Does the consuming public know this, however?
There is something more to be considered than mere safety–whether or not the added chemical really contributes something worthwhile to the food. The attitude of the thinking part of the consuming public is very well summed up, it seems to me, in a resolution adopted by the board of directors of the General Federation of Women’s Clubs and made a part of the Delaney hearing record. In substance, it says that non nutritive ingredients should not be added to any food product unless their addition serves some purpose useful to the consumer and unless they have first been certified by the Food and Drug Administration to be non-injurious, nor should any such proposed ingredients be added if they are to be substituted, in whole or in part, for natural food elements.
Some time ago I had a visit from a group of bakers. Our talk naturally drifted to the Delaney hearings, to the matter of emulsifiers in bread and to other subjects of importance to that industry. I remarked that I wondered whether the time had not come for the bakers’ association to do some soul searching with the object of possibly reorienting its program. Were bakers right in trying to produce the whitest and most uniform loaf of bread possible, in the belief that that was what the consumer wanted? Was it possible that they had misinterpreted consumer desires? If the consumer reaction on bread means anything, doesn’t it mean that a growing proportion of the population is dissatisfied with what one consumer described as “cotton fluff wrapped up in a skin”? I cited the growing popularity of breads and rolls that feature the use of unbleached flour and natural food shortenings.
I wondered whether there was any real reason today for believing that the average housewife wants the completely white product attained only by the use of bleached flour; whether there was anything normally repulsive to the housewife in the natural creamy color of unbleached flour; or whether there was any serious objection because different batches of flour differ in degree of color. Isn’t it about time to re-evaluate what the consumer wants and then give it to her?
Don’t misunderstand me. I am a chemist and I know that many of the products of the chemical industry vastly improve the nutritive value and palatability of foods. I note that the label of a very popular brand of rolls made with unbleached flour carries a sodium propionate declaration. This suggests that the consumer is not necessarily offended by the use of a chemical that serves a useful purpose and is wholly without public health significance.
Suggested Solutions
Isn’t it about time for the food industry, whether it be the baking segment or any other segment, to begin to consider and evaluate what the consumer really desires and get back to first principles in so far as it is possible to do so? At the same time, it should use every means at its disposal, by education and by advertising, to offset the propaganda of nutrition quacks who actually are trying to sell something, but who have convinced the radio public, at least, that they are the only ones who stand between the nation and nutritional disaster.
To sum up, it seems to me there are four jobs the food industry ought to undertake without delay:
- It should re-examine present ideas of what consumers want and find out what they really do want.
- It should revise, where necessary, its production practices to meet consumer demand.
- It should take steps to maintain consumer confidence in the American food supply by an educational campaign to counteract the false teachings of nutrition quacks.
- It should support sound legislation to prevent the use in foods of chemicals untested for safety or serving no definitely useful purpose.
Blood Tocopherol Values in Normal Human Adults and Incidence of Vitamin E Deficiency
Authors: Philip L. Harris, Edward G. Hardenbrook, Frederick P. Dean, Eleanor R. Cusack, and James L. Jensen.
* * *
Under controlled experimental conditions, the human requirement for Vit. E varies 6-fold or more, depending on other dietary factors–primarily the content of unsaturated fat.1,2 This discovery has stimulated interest in the Vit. E nutriture of populations of normal subjects on practical diets.
For this reason we present in Table I the results of a survey of blood tocopherol levels made in Rochester, N. Y., as part of a comprehensive study of the influence of multivitamin supplementation on blood levels of Vit. A, C, E, and carotene.
TABLE I. Frequency Distribution of Plasma Tocopherol in Normal Adults (Rochester, N. Y.).
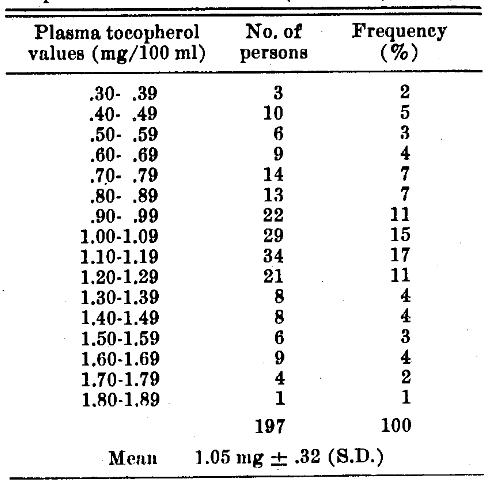
The subjects, presumably in good health and receiving adequate diets, were 120 male and 77 female industrial workers, 17 to 64 years of age. At the beginning of the study, before supplementation, the values ranged from 0.36 to 1.80 mg/100 ml. (For tocopherol analysis, the method of Quaife and Harris was used3 on blood samples drawn in the morning while the subjects were in a fasting state.) In agreement with the mean values found for other populations (Table II), the mean value was 1.05.32 mg tocopherol/100 ml plasma. Thus the present data confirm the generally accepted conclusion that the normal plasma tocopherol level for humans is very close to 1.0 mg/100 ml.
TABLE II. Plasma Tocopherol in Normal Humans.
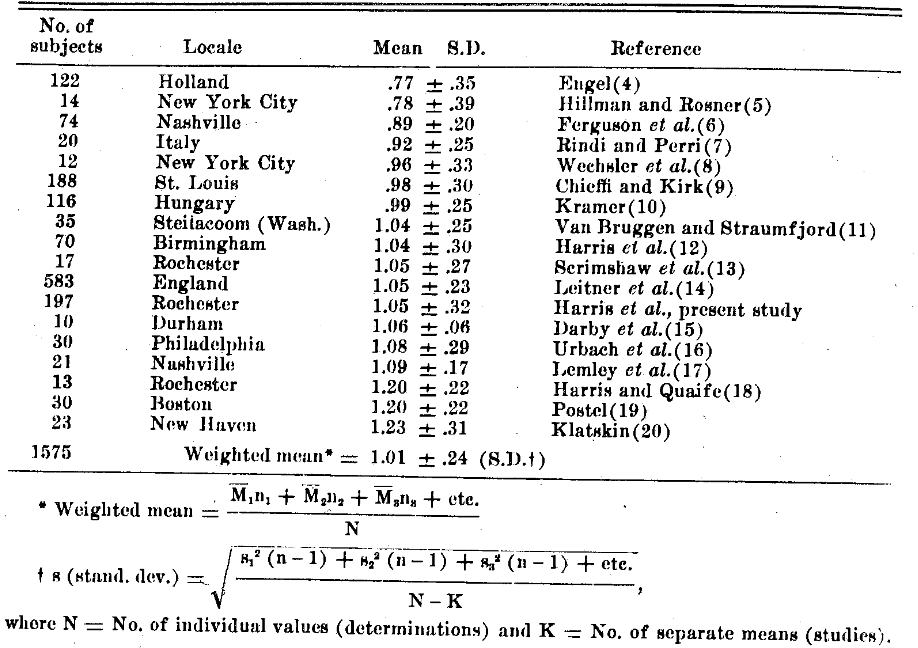
It is important to recognize, as Edwin et al.21 have pointed out in their critical evaluation of analytical procedures used for measuring tocopherols in animal tissues, that most such values represent total reducing materials rather than tocopherol per se. Chromenols, reduced ubiquinones, and other antioxidants as well as tocopherols may be present in blood and other animal tissues; these are measured as tocopherol unless such a step as paper chromatography as recommended by Edwin and coworkers is included in the procedure.
In future nutritional surveys, measuring some physiological function related to the tocopherol nutriture of the body would be even better than measuring tocopherol per se. Such a method–measurement of the susceptibility of red blood cells to hemolysis–is now available.* Increased susceptibility of red blood cells to hemolysis is the earliest indication of Vit. E deficiency, as was discovered first in animals22 and is now known to apply to human infants23,24 and adults.1,2
In both children and adults a significant degree of red blood cell hemolysis occurs when serum or plasma tocopherol concentration falls below 0.5 mg/100 ml. Using this relationship, a tentative interpretation with respect to incidence of Vit. E deficiency can be made of the data from the present survey and those previously reported.
The Rochester study shows that 7% of the subjects had values in the deficiency range. Only 3 other surveys gave the distribution in detail; these show that 12% of the Holland subjects, 4% of the Birmingham subjects, and 2% of the British subjects had blood tocopherol values in the deficiency range.
There is not yet enough information available for us to speculate on the diets of the persons having low blood tocopherol values, especially concerning the newly-raised questions: were the 𝛼-tocopherol intakes (in contrast to total tocopherol) relatively low, or were the unsaturated fat intakes relatively high? Whichever the case, these data show that a significant number of persons had a tocopherol deficiency symptom. Future nutrition surveys, using the blood hemolysis test, will not only supply interesting comparative data on incidence of tocopherol deficiency–they may also show relationships between dietary tocopherol intake and red blood cell hemolysis test values from which tocopherol requirements (minimum daily requirement under a variety of conditions) can be calculated.
Summary
The mean tocopherol concentration in 197 factory workers in Rochester. N. Y. was 1.05 ± 0.32 mg/100 ml. About 7% of the subjects had less than 0.50 mg tocopherol/100 ml, the level below which red blood cell hemolysis tests become positive, indicating Vit. E deficiency.
Note:
*The test is easy to do, and the results are unequivocal.25 The red blood cells from a few drops of blood are washed, then incubated with dilute hydrogen peroxide. The amount of hemoglobin released by rupture of red blood cells is measured colorimetrically and expressed as a percentage of complete hemolysis. Persons with adequate vit E nutriture have red blood cells that are completely resistant; those low in tocopherol have red blood cells that show a significant degree of hemolysis–over 20%.
References Cited:
- Horwitt, M. K., J. Clin. Nutrition, 1960, v8, 451.
- —, Borden’s Rev. Nutrition Research, 1961, v22, 1.
- Quaife, M. L., Harris, P. L., Biol. Chem., 1944, v156, 499.
- Engel, C., Y. Acad. Sci., 1949, v52, 292.
- Hillman, R. W., Rosner, M. C., Nutrition, 1958, v64, 605.
- Ferguson, M. W., Bridgforth, E., Quaife, M. L., Martin, M. P., Cannon, R. O., McGanity, W. J.. Newbill, J., Darby, W. J.,, 1955, v55, 305.
- Rindi, G., Perri, V., Z. Vitaminforsch., 1958, v28, 274.
- Wechsler, I. S., Mayer, G. G., Sobotka, H., Soc. Exp. Biol. and Med., 1941, v47, 152.
- Chieffi, M., Kirk, J. E., Gerontol., 1951, v6, 17.
- Kramer, M., Z. Vitaminforsch., 1955-6, v26, 58.
- Van Bruggen, J. T., Straumfjord, J. V., Lab. & Clin. Med., 1948, v33, 67.
- Harris, P. L., Hickman, K. C. D., Jensen, J. L., Spies, T. D., J. Public Health, 1946, v36, 155.
- Scrimshaw, N. S., Greer, R. B., Goodland, R. L., N. Y. Acad. Sci., 1949, v52, 312.
- Leitner, Z. A., Moore, T., Sharman, I. M., J. Nutrition, 1960, v14, 281.
- Darby, W. J., Cherrington, M. E., Ruffin, J. M., Soc. Exp. Biol. and Med., 1946, v63, 310.
- Urbach, C., Hickman, K. C. D., Harris, P. L., Med. Surg., 1952, v10, 7.
- Lemley, J. M., Gale, R. G., Furman, R. H., Cherrington, M. E., Darby, W. J., Meneely, G. R., Heart J., 1949, v37, 1029.
- Harris, P. L., Quaife, M. L., Biol. Chem., 1944, v156, 499.
- Postel, S., Clin. Invest., 1956, v35, 1345.
- Klatskin, G., Krehl, W. A.,, 1950, v29, 1528.
- Edwin, E. E., Diplock, A. T., Bunyan, J., Green, J., J., 1960, v75, 450.
- Rose, C. S., Gyorgy, P., Blood, 1950, v5, 1062.
- Mackenzie, J. B., Pediatrics, 1954, v13, 346.
- Gordon, H. H., Nitowsky, H. M., Tildon, B. S., Levin, S.,, 1958, v21, 673.
- Gordon, H. H., Nitowsky, H. M., Cornblath, M., M.A. Am. J. Diseases Child., 1955, v90, 669.