
Access to all articles, new health classes, discounts in our store, and more!
The Use of a Microscope For Electrocardiographic Measurement
Published in Experimental Medicine and Surgery, Vol. 23, No. 4, December 1965.
* * *
Introduction
The importance of accurate electrocardiographic mensuration and the inadequacy of the present clinical techniques are well known. Occasional, but very limited, reference has been made to measurement with magnification.1 This study is designed to analyze the accuracy of measurement with magnification of the standard waves, segments, and intervals in the conventional limb leads of a group of healthy young men.
Method of Investigation
Forty-five presumably healthy junior dental students participated in the study. The age distribution is outlined (Table 1). Electrocardiographic records were obtained with the Burdick instrument at 10:00 A.M. after a regular breakfast at approximately 7:30 A.M.
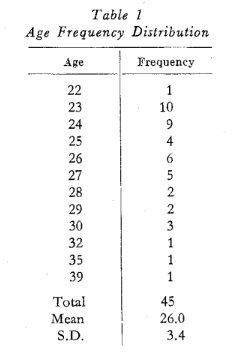
Each of the conventional waves, segments, and leads was determined with a dissecting microscope (60X). A second measurement by the same examiner was accomplished later with no knowledge of the earlier findings. All information was placed on punch cards for electronic calculation of coefficients of correlation and probability values.
Results
Table 2 lists the sample sizes and the correlation coefficient for each of the parameters studied in the three leads. It is clear from this chart that all of the correlations are high, ranging from a minimum of 0.86611 (Fig. 1) for the height of the ST deflection in lead II to a maximum of 0.99973 for the height of the QRS complex in lead III (Fig. 2). It is obvious that, even with magnification, it is more difficult to measure fractions of a millimeter (Fig. 1) than millimeters (Fig. 2). The P value for all correlations proved statistically significant (P<0.001).
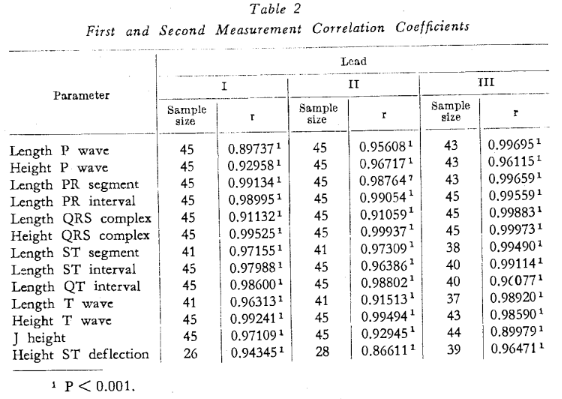
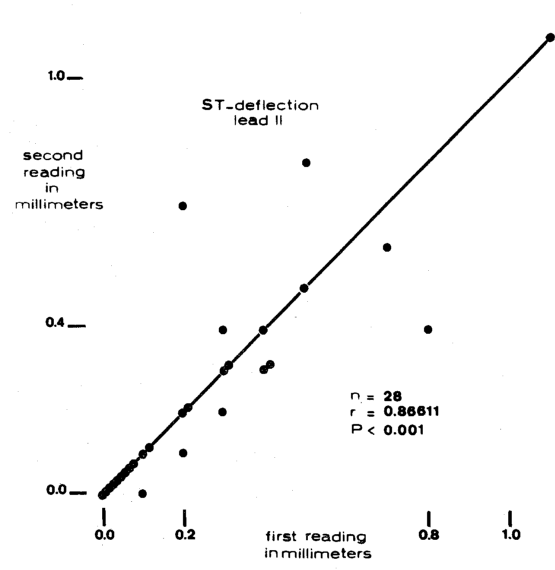
Fig. 1.
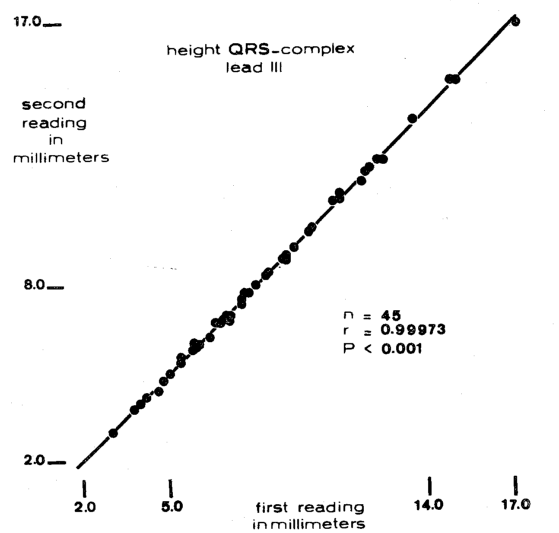
Fig. 2.
Discussion
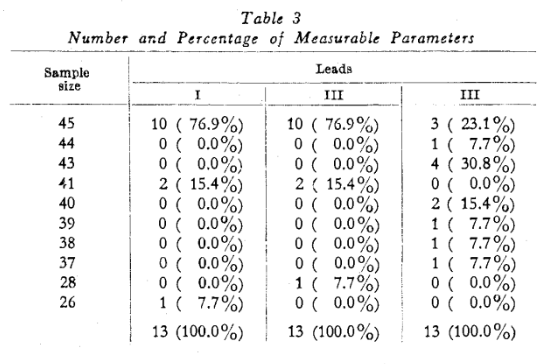
While the results indicate that measurement under magnification is quite consistent, there are other noteworthy observations which warrant consideration. For example, the mere inability to measure is a significant index. It should be recalled that the total sample was 45. However, Table 2 shows that, in some instances, certain parameters could not be measured in all 45 cases. For example, the length of the P wave in lead I was measurable in all 45 subjects. However, in only 26 of the 45 was the ST deflection quantitatable. Hence, it is appropriate to view the percentage frequency of mensuration of the thirteen parameters in the three leads (Table 3). It will be noted that the overwhelming number of parameters (76.9 per cent) were read in all subjects (45) in leads I and II. This was not true in lead III where only 23.1 per cent of the thirteen parameters could be measured in all subjects.
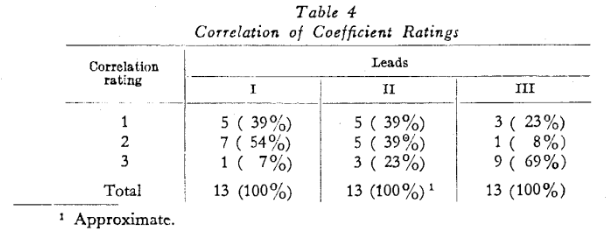
There is another way of viewing the problem of accuracy of measurement. Table 2 shows that the correlation coefficient for the P wave was least in lead I(0.89737), slightly higher in lead II (0.95608), and highest in lead III (0.99695). Through this type of analysis, it is possible to determine which parameter and lead provide the highest reproducibility (Table 4). The lowest, intermediate, and highest correlation coefficients are assigned the numbers one, two, and three respectively (left column). It will be observed that in lead III most of the parameters (69%) were rated highest. The frequencies (Table 4) are less sharply defined in leads I and II.
Finally, a consideration of the rank order of reproducibility of parameters in leads I, II, and III results in quite a different picture for each lead (Table 2). However, the height of the QRS complex demonstrates the highest coefficient of correlation in all three leads. Thus, this parameter appears to be the most accurately quantitatable of the thirteen items measured.
The utilization of magnification, as described in this report, for reading the electrocardiogram provides a method of high reproducibility. As a research tool it would be useful in determining small changes such as those that occur with increasing age (Fig. 3).2
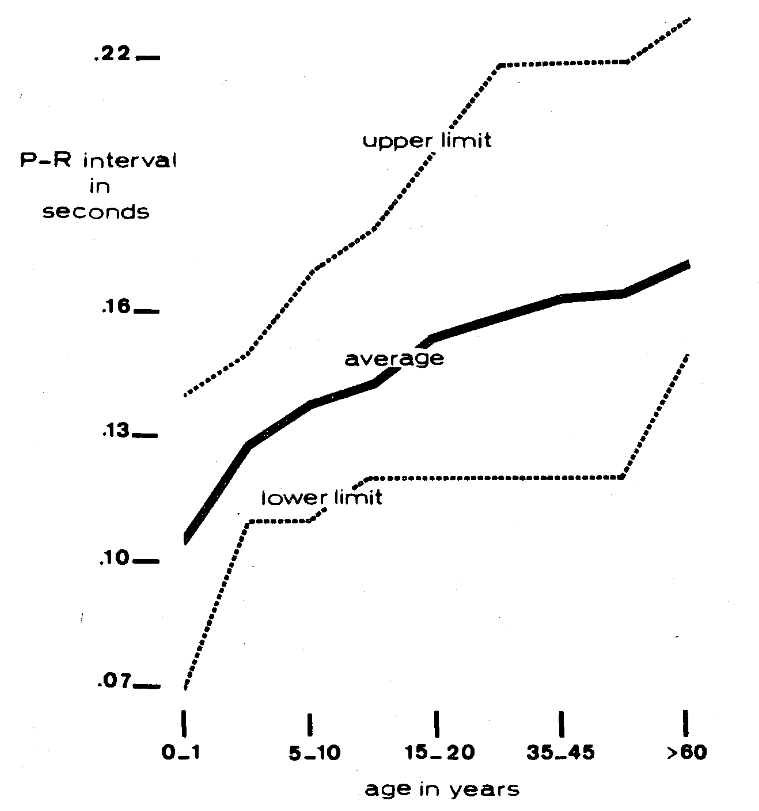
Fig. 3.
Summary
Forty-five presumably healthy junior dental students were subjected to an electrocardiogram utilizing leads I, II, and III.
The conventional waves, segments, and intervals were measured and later redetermined with no knowledge of the initial values.
The coefficients of all thirteen parameters in the three leads ranged from 0.86611 to 0.99973, and all were statistically significant (P = 0.001).
Although more parameters were measurable in more subjects in leads I and II, the coefficients of correlation were higher in lead III for nine of the thirteen items.
The height of the QRS complex was the most quantitatable item in each lead.
References Cited:
- Lepeschkin, E.: Modern electrocardiography. The Williams and Wilkins Co., Baltimore. I, p. 41, 1951.
- Lepeschkin, E.: Modern electrocardiography. The Williams and Wilkins Co., Baltimore. I, p. 153, 1951.