
Access to all articles, new health classes, discounts in our store, and more!
The Predictive Significance of Common Observations in the Health Check Up
Published in Journal of The Medical Association of the State of Alabama, Vol. 46, No. 9, March 1977.
* * *
Introduction
In conventional medicine, the usual sequence of events involves a comparative analysis of a particular classical syndrome and its biochemical constituents. For example, in the traditional multiple testing program, considerable attention is directed to blood glucose levels as they relate to diabetes mellitus and the serum cholesterol concentration in terms of ischemic heart disease. Predictive medicine, concerned as it is with the anticipation of disease, has given rise to an unique experimental model. Four examples will serve as the basis of this report.
Anatomy of Man
For purposes of this discussion, man may be viewed as a multilamellated sphere.1 Hence, any way one turns a ball, it looks the same. In that context, however one diagnostically inspects man from the outside, the predictability is the same. It must be granted, viewed in one way, there may be a limp characteristic of a cerebrovascular accident; examined from a different angle, there are pimples. But these and all other peripheral stigmata possess a common denominator; they signify an index of the syndrome of sickness (Figure One).
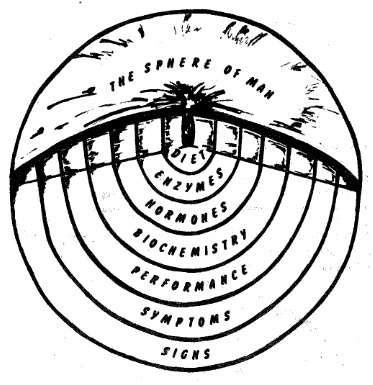
Figure One. Man may be likened to a lamellated sphere. The periphery of both are easily inspected. Layers can be removed which progressively expose the core problems.
Additionally, as progressively deeper layers of a lamellated sphere are examined, one eventually approaches the core. In man also, diagnostic layers may be stripped away until the central problems are brought into focus (Figure One). If one grants that the only physiologic indication for an aspirin, for example, is an aspirin deficiency, then the core possibilities are very limited. This becomes more evident when it is remembered that the air one breathes is federalized and the water one drinks is also under governmental control. Viewed in this context, diet, shown in this illustration, and physical activity along with tobacco, alcohol, coffee and tea become the most important core factors.
Signs: The outer, the most peripheral, ring is readily inspected in both a sphere and in man. At his level, one can make three observations. First, it is possible to identify evidence of the ravages of classical disease such as the pathognomonic gait associated with a cerebrovascular accident, a skin eruption typical of impetigo, a carious tooth. This type of information fits the box on the right in Figure Two.
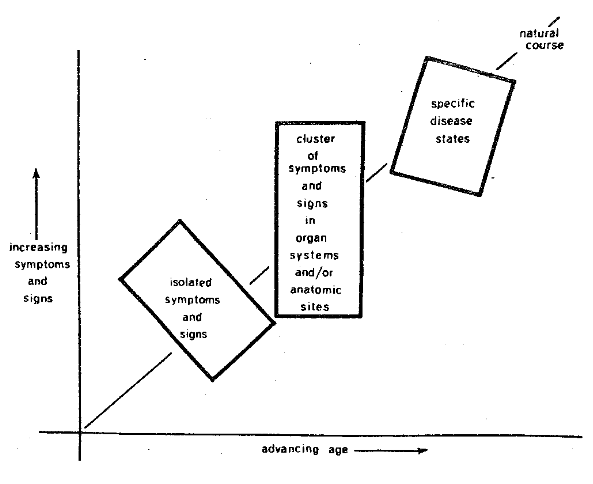
Figure Two. The periphery of man provides three sets of information. First, the presence of obvious classical disease (box on the right), symptoms and signs in systems and sites (box in the middle), and early seemingly unrelated findings (box on the left).
The end product of such an analysis is demonstrated in Figure Three. Thus, the patient is viewed as suffering with hypertension, a problem generally recognized as of unknown origin. It will be observed that this 47-year-old white female also suffers with psoriasis, a skin problem of unknown etiology. Clearly, there is presently no known cause for rheumatoid arthritis. It is suggested, in this final diagnostic sheet, that the patient suffers with recurrent nose bleeds due to undetermined cause. In the interest of expedition, one must add that the aphthous lesions in the mouth, the emphysema, the arteriosclerosis, and so forth, have as a common denominator an obscure if not unknown causation. By act, if not by word, it is usually held that the problems shown in Figure Three are relatively independent or unrelated in terms of their causes. Phrased another way, in the traditional medical sense, man is viewed much like an automobile so that it is possible to suffer with transmission problems, inadequate springs, and unsatisfactory brakes! What is particularly regrettable is that this kind of diagnosis, unfortunately, is simply an accounting of the damage largely derived from a peripheral inspection of man.
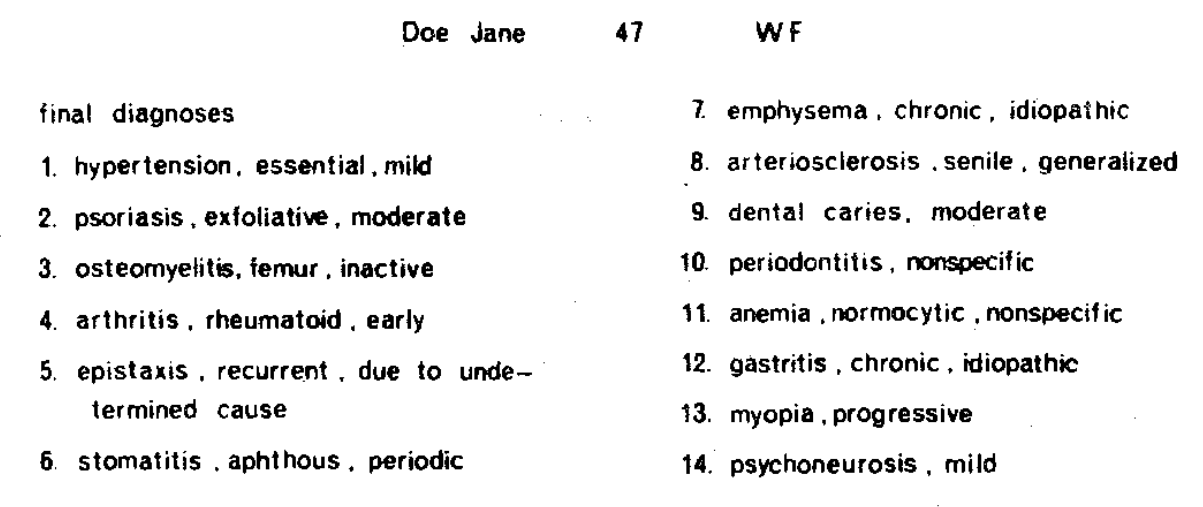
Figure Three. A typical diagnostic workup showing an array of problems having as a common denominator unknown etiology.
Second, signs can be obtained at this peripheral level which provide an estimate of pathosis referable to a particular system, such as the gastrointestinal tract, or a special site like the eye even though the findings do not fit the textbook description of a particular syndrome or disease. This type of information is shown in the center box in Figure Two.
Finally, it is possible to establish simply the numbers and kinds of signs without any regard to how or where they fit into systems or sites or classical disease categories. In other words, one can simply use the total number of clinical findings as an index of incipient disease.
Symptoms: If one strips off the outer layer (Figure One), into focus comes the zone of symptoms. It must be granted, where the outer layer ends and the most peripheral one begins can be quite arbitrary. Also, it should be pointed out that the designation of whether a finding is a symptom or a sign can be argued. For example, the bleeding observed by a doctor is classified as a sign but would be regarded as a symptom when reported by the patient.
Symptoms are not as readily discernible as signs and can only be derived through interrogation by means of the classical interview or some form of questionnaire. The cardinal point to be recognized, for predictive purposes, is that symptoms generally precede signs of disease. Thus, unaccountable fatigue may well be the most significant and sometimes the only antecedent of a myocardial infarct. For purposes of this discussion, evidence obtained in this zone may anticipate more peripheral problems.
Performance: Stripping off the second layer unearths the world of performance (Figure One). Impairment in performance generally heralds the appearance of symptoms and signs. Physical activity is frequently used in the evaluation of organ and system activity as in the case of the treadmill for the assessment of cardiovascular state. The cardinal point to underline at this time is that a disturbance in performance precedes the advent of symptoms and signs of disease. Hence, common sense would dictate that this zone can be used as an effective predictor of clinical change.
Biochemical State: Removing the performance layer brings into view the biochemical pattern. This is a very complex but productive area, and the number of available biochemical parameters seems almost endless. Biochemical measures of blood, saliva, urine, hair, nails, and breath provide significant diagnostic and prognostic data.
For example, the American Diabetes Association now claims that the clinical diabetic patient has been suffering with chemical diabetes mellitus for at least ten years.
Hormonal Balance: Dissecting off the biochemical layer brings into view the deeper hormonal area. It is here that measures of endocrine state, such as protein-bound iodine, are disclosed. Aberrations in hormonal state may precede changes in biochemical homeostasis. For example, the hypothyroid patient frequently demonstrates hypercholesterolemia. Hyperadrenal cortical activity is reflected by changes in blood glucose or electrolytes. Hence, hormonal imbalances may become predictive of problems in the more peripheral layers.
Enzymes: At the near center of the core is the enzyme pattern. Many of the two thousand known enzymes can be used for clinical purposes. For example, serum glutamic oxalacetic transaminase, popularly referred to as SGOT, is now frequently utilized as a predictive tool of impending cardiovascular disease.
The Core Problem: Finally, one reaches the center of the sphere which, in Figure One, is illustrated by diet. Since dietary nutrients are the building blocks from which hormones and enzymes are made, it is apparent that all of the peripheral layers reveal the effects of dietary imbalances, inadequacies, or excesses. As has been pointed out earlier, physical fitness can also be regarded as a core problem. Surely, genetics must always be considered. Finally, other central variables receiving increasing attention are pollutants, food preservatives, coffee and tea, alcohol, and tobacco consumption.
When there are no core problems and especially when optimal diet exists, all peripheral layers are in order (Figure Four). Thus, in the healthy man, all levels are in balance as shown by an optimal diet, enzyme and hormone balance, biochemical homeostasis, physiologic performance, and no peripheral symptoms and signs.
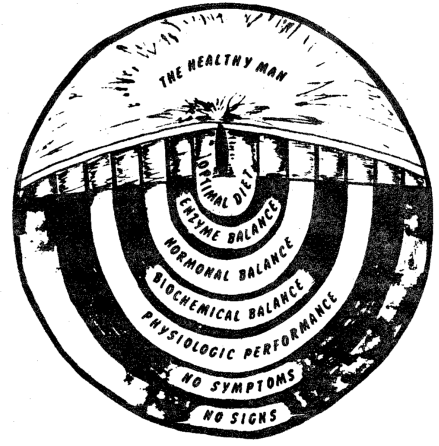
Figure Four. In healthy man, all levels are in balance.
On the other hand, when there is a core problem, such as a poor diet, there are reverberations throughout all levels (Figure Five). This begins in the more central zone of enzymes and proceeds, in order, to the peripheral layers of symptoms and signs. However, it should be emphasized that this eruption from the center out requires time, and this is the incubation period for chronic disease.
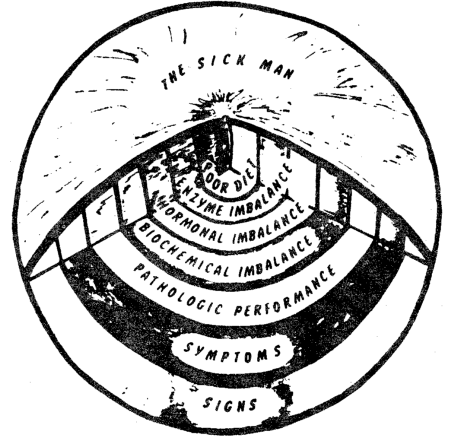
Figure Five. Following a core problem (diet, exercise, etc.), there are eventual disturbances in order at the enzyme level, hormones, biochemical state, performance, and finally symptoms and signs.
A Practical Application
Each of the diagnostic layers such as the signs, symptoms, performance, biochemistry, hormones, enzymes, and diet is interrelated with every other level. One such observation is reported here which links physical fitness as a core problem with a peripheral estimate of signs and symptoms as judged by sick call.
The Officers Candidate School at Fort Benning, Georgia, consists of an intensive twenty-four week military training program. At the very start of the course, each student is carefully graded by means of a variety of mental and physical tests. One of the many measuring procedures is the time required to run one mile. During the subsequent twenty-four week training period, a record is kept of military and medical parameters indicating the number of times each student reports for sick call. Figure Six pictorially portrays the relationship of the time required to run one mile, as shown on the abscissa, and the frequency of sick call, described on the ordinate, in 392 soldiers deemed healthy enough to be trained for officer status. The evidence is clear that those individuals who run the mile fastest at the start of the program, in less than six minutes and seventeen seconds, are the very same persons who subsequently report least for sick call (1.5 times). Conversely, those with the longest initial scores for the mile run, greater than six minutes and fifty-four seconds, are characterized by the highest sick call frequency, 2.2 visits. Thus, those with the best performance, as judged by the mile run, subsequently demonstrate the least number of peripheral problems. Those with the poorest performance records display the most symptoms and signs.
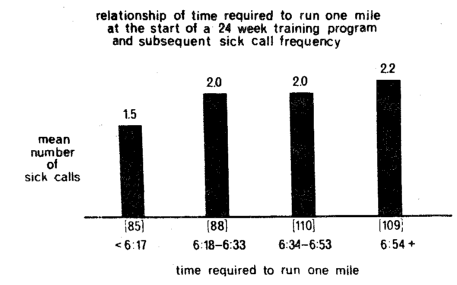
Figure Six. The relationship of time required to run one mile (on the abscissa) at the start of a 24 week training period and the subsequent frequency of sick call. This suggests the predictive worth of one measure of performance (running a mile) and the more peripheral manifestations of disease.
These experimental findings are consistent with the report of a negative association between degree of exercise and death in men aged 45 to 85+ years of age. In other words, as the degree of exercise increases from none to slight, moderate, and heavy, deaths decrease progressively. Between no exercise and heavy exercise, the differences range from five to tenfold.
It should be evident that what one wishes to anticipate depends upon the layer one desires to accept as the effect and which layer one wishes to regard as the cause.
Physiologic Versus Normal Values
Precisely what is the significance of various parameters in a predictive system depends not only upon the experimental model as just described but is also a function of what is a physiologic versus a normal value.2
The term normal stems from the Latin normalis, which means according to the pattern. Hence, in its purest sense etymologically (and this is its statistical connotation), normal suggests typical, usual, average.
The clinician usually employs the word normal to define the healthy state. For example, he frequently remarks that a patient is normal or that the blood sugar or cholesterol values are normal when he actually means that the parameter in question is within physiologic limits.
Hence, in the practitioner’s mind, since normal implies average and normal implies healthy and things equal to the same thing are equal to each other, normal becomes interchangeable with that which is healthy. The simplest example that average, or normal, and healthy, or normal, are not synonymous is the fact that 95 per cent of Americans suffer with dental decay. It is, therefore, normal (meaning typical or usual) to have this problem. In other words, the average American has it. However, it is obviously not healthy or physiologic to exhibit dental caries.
Fundamentally, there are three techniques employed to develop standards for health and disease.
The Epidemiologic Approach: The most common technique for determining the so-called normal value is to measure the parameter in question in a large sample of presumably well individuals. Particular mention should be made that most criteria for health are generally quite arbitrary since the sample studied is, for example, an ambulatory group or hospital personnel. The data are then arrayed and generally found to fit the typical unimodal or Gaussian curve. Then, on a purely arbitrary basis, the mean and two standard deviations, namely 95 per cent of the intermediate values, are held to represent the physiologic range for the parameter under consideration.
In such a system, the assumption is made that, for example, students, employees, health examinees, and blood bank donors are healthy. This hypothesis is not based on fact. Actually, most multiple testing programs of such persons indicate that a significant number has one or more previously undetected diseases. For example, according to the United States Department of Health, Education, and Welfare, the incidence of one or more chronic conditions, meaning illnesses, diseases, or impairments, even in young people less than 17 years old, was one in five or approximately 20 per cent in 1962-1963 and has climbed to almost one in four, in other words about 23 per cent, in 1966-1967. Hence, one must recognize that the criteria for health sampling are very arbitrary. Multiphasic screening of allegedly healthy persons indicates that one cannot make the assumption that two standard deviations, which includes 95 per cent of the population, are well. It should be abundantly evident from this brief discussion that the presently employed method of ascertaining the physiologic or so-called normal range for a diagnostic parameter is most arbitrary.
The Sta-Ten Concept: For the reasons offered earlier, many investigators have been concerned with the development of more meaningful standards for health and disease. For example, one technique divides the typical unimodal patterns into sta-tens which are ten units of standard deviation. The mode, according to these investigators, represents the ideal and is assigned the score of five. Values which fall 0 to 0.5 standard deviation below the mode are numbered four and called low modal, 0.5 to 1.0 standard deviation below are number three or mild decrease, 1.0 to 1.5 are assigned two and judged as moderate decrease, 1.5 to 2.0 below are listed as one or marked decrease, and 2.0 and below are numbered zero and represent very marked decrease. In conventional medicine, only values outside two standard deviations are viewed as pathologic. Similarly, the values six, seven, eight, nine, and ten are utilized for scores above the mode in one-half standard deviation groups.
The most obvious benefit from this system is its recognition that small variations from the mode signify the development of a pathologic process. The most apparent shortcoming of this approach is the assumption that the mode is synonymous with optimal health.
The Symptom-Sign Free Concept: From the earlier discussion, it is clear that there is still considerable debate as to what should be regarded as the physiologic limits for a particular biochemical parameter. The point has been made that the present concept of a physiologic range is developed from an analysis of presumably healthy subjects. Even though such persons are not obviously ill, they may, nonetheless, have an undetected disorder or exhibit symptoms and signs which are clearly not suggestive of a state of health.
It seems fair to assume that an individual without symptoms and without signs is probably healthier than one with clinical findings. Considering this assumption, a study is here reported of a fasting blood glucose range in a group with and without symptoms and signs (Figure Seven).
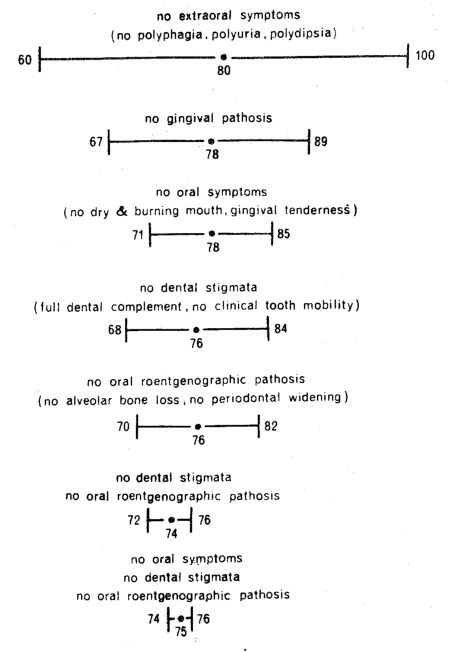
Figure Seven. The technique for the development of the physiologic range for fasting blood glucose by developing a progressively symptomless and signfree group. By this method, the range progressively shrinks.
One hundred dental patients, seen for routine care, were questioned regarding symptoms and examined for signs generally recognized as indicative of diabetes mellitus. Though the main emphasis was placed upon the oral cavity, some few extraoral findings such as polyphagia, polydipsia, and polyuria, were also recorded. Each individual was also studied by means of the classical three-hour oral glucose tolerance test. For purposes of this report, only the fasting blood glucose determinations will be considered.
An analysis of fasting blood glucose was first made for those of the original one hundred subjects free of a single extraoral symptom. The 82 subjects without polyphagia, though some may have had polyuria and/or polydipsia, showed a mean and standard deviation of 81 ± 21 mgm. per cent. A similar analysis of the 82 polydipsia-free patients, though some may have reported polyphagia and/or polyuria, yielded values of 81 ± 20 mgm. per cent. Finally, the 71 patients without polyuria, with or without polyphagia or polydipsia, netted a score of 80 ± 18 mgm. per cent. It is clear from an analysis of those patients lacking any one of these findings that the means and standard deviations are very similar. In order to develop a simple chart, Figure Seven shows at the top only the mean and standard deviation for the 50 subjects without the extraoral symptoms of polyphagia, polyuria, and polydipsia. It will be noted that this relatively symptom-free group is characterized by a fasting blood glucose of 80 ± 20 mgm. per cent.
In order to establish the fasting blood glucose range on a more quantitatable basis, gingival health was studied. Sixteen of the original 140 subjects demonstrated physiologic gingival hue, color, stippling, and sulcus depth around the teeth. It is important to emphasize that some of the patients may have reported one or more of the extraoral symptoms and signs previously mentioned. This group, shown as the second line from the top, characterized by healthy gingiva, showed a value of 78 ± 11 mgm. per cent fasting blood glucose (Figure Seven). Line two, representing gingival health, compared to the initial analysis on line one, shows that the mean has decreased only slightly from 80 to 78, but the standard deviation has been cut in half from 20 to 11.
A similar analysis was made for the 38 subjects without the oral symptoms of gingival tenderness, dry and burning mouth. it will be noted, in line three, that the mean has remained the same at 78, but the range has decreased from 11 in line two to 7 in line three.
Similar analyses were made for the 16 subjects with no dental stigmata, that is, a full complement of teeth and no clinical tooth mobility as pictured in line four from the top, and for the 11 persons without oral roentgenographic evidence of disease as judged by no alveolar bone loss and no periodontal widening which is line five.
Finally, the means and standard deviations were derived for the groups of subjects without combinations of symptoms and signs. Figure Seven shows the scores for the five patients without dental stigmata and oral roentgenographic pathosis. This is the second line from the bottom. Also shown at the very bottom are the values for the three subjects without oral symptoms, dental signs, and x-ray evidence of pathosis.
A number of points are worthy of mention. First, two-thirds of the asymptomatic patients, in terms of extraoral findings, ranged from 60 to 100 mgm. per cent fasting blood glucose as shown on the top line. Interestingly enough, this is the presently accepted range for fasting blood glucose. Second, by employing different, clinical criteria for the healthy state, the means decrease slightly and the ranges shrink dramatically. Third, by stiffening the requirements for health, namely by insisting on progressively fewer symptoms and signs, the range shrinks to almost zero. Finally, it will be noted that one runs out of people before one exhausts the parameters! This technique for the establishment of physiologic ranges has been investigated for a number of different parameters. And, in all instances, the patterns are the same.
Linear Versus Curvilinear Functions
By act, if not by word, traditional medicine is based upon a philosophy that the relationship between different parameters with regard to health and disease is a linear function.3 For example, the higher the blood glucose the more pathologic is this particular parameter. This is abundantly exemplified by the usual description of the genesis of diabetes mellitus (Figure Eight). At one point, on the extreme left, there is no hyperglycemia, no glycosuria, and no clinical findings. Subsequently, there is the occasional appearance of hyperglycemia with no glycosuria or clinical symptoms and signs in the third column, there is now chronic hyperglycemia and occasional glycosuria without clinical findings. Finally, both hyperglycemia and glycosuria are constant, and there are clinical symptoms and signs. It is at this point that, by definition, the patient is given a diagnosis of diabetes mellitus. Three items deserve special consideration. First, the sequence of events underscores the gradation concept of health and disease. Second, the story underlines the arbitrary delineation of health and sickness. Finally, the chart emphasizes one of the common characteristics of traditional medicine, namely, that many biochemical patterns are viewed in a dichotomy. In this particular instance, the problem in traditional thinking is one of hyperglycemia versus nonhyperglycemia. The simple fact of the matter is that all biochemical parameters must be viewed as a trichotomy rather than a dichotomy. In the instance just cited, recognition is given to hyperglycemia versus nonhyperglycemia. No attention is accorded hypoglycemia even though the latter is recognized as a possible early diabetic sign.
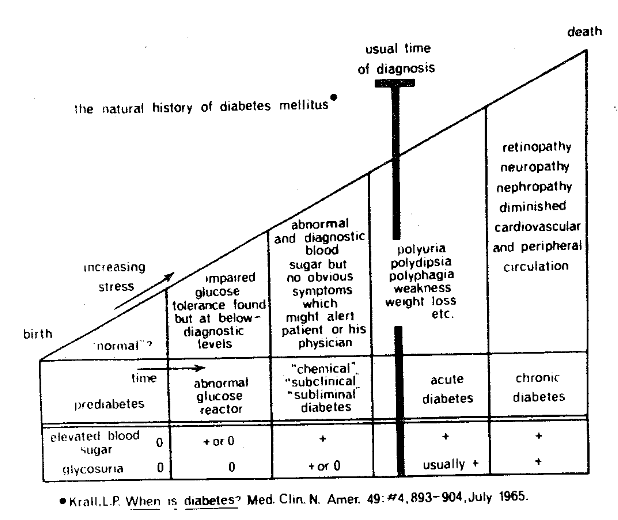
Figure Eight. A classical clinical-biochemical description of the course of events in diabetes mellitus.
A simple yet most graphic representation of the trichotomy concept has already been reported (Figure Nine). The packed cell volume, or hematocrit, was measured in 180 women in 1958 and subsequently evaluated with regard to mortality ten years later. Described on the abscissa are the hematocrit groups ranging, from left to right, from the low to the high scores as determined in 1958. Pictured on the ordinate are the percentage of deaths in 1968. It is abundantly evident that the highest mortality figures occur at both ends of the packed cell volume scale. Also, the chart shows that the individuals with the middle scores, in this case hematocrit values of 40 to 43, are paralleled by the least mortality.
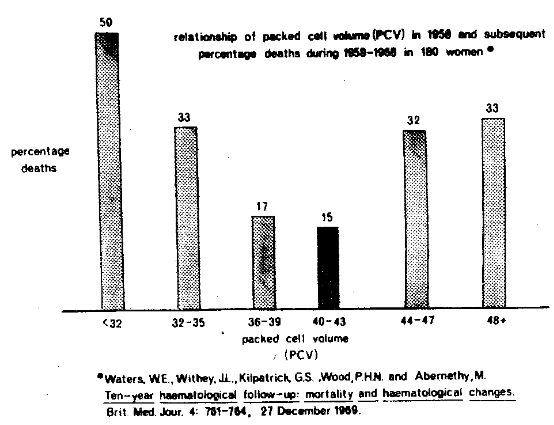
Figure Nine. The curvilinear or parabolic relationship of mortality and packed cell volume depicting the optimal hematocrit as being in the middle.
Mortality and the curvilinear concept are not restricted to biochemical findings (Figure Ten). For example, in a study of over one million men and women, the men who reported approximately seven hours of sleep per night had the lowest death rate. Those who reported more or less sleep displayed progressively higher death rates.
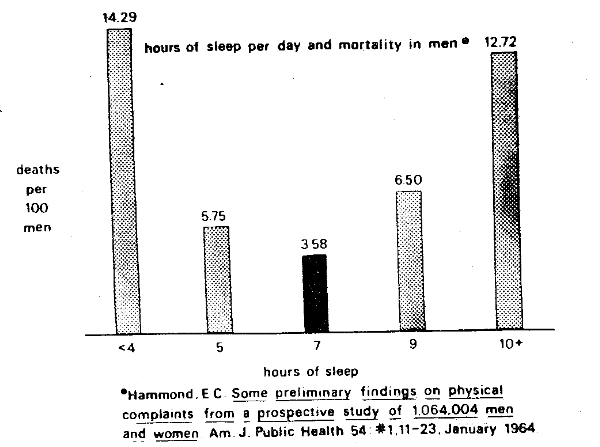
Figure Ten. The curvilinear or parabolic relationship of mortality and hours of sleep per day depicting the optimal sleep time of seven hours.
Two points are worthy of special mention. First, many relationships are of a parabolic rather than a linear form. Additionally, the curvilinearity is a function of definition of physiologic standards (Figure Eleven). Specifically, it will be noted that the more narrow the physiologic standards, as shown by the upper curve, the more sharply defined is the parabolic picture.
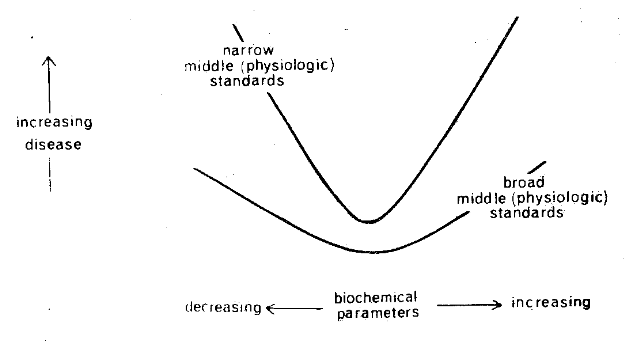
Figure Eleven. The correlation of a biochemical and clinical parameter is parabolic. The curvilinearity is in part a function of the definition of hyper-, hypo- and normo- for the biochemical technique in question.
The parabolic pattern is also, in part, a function of age (Figure Twelve). In the relatively young, as depicted by the lower curve, the parabola is quite flat. With advancing time, the picture becomes more sharply defined. This is clearly demonstrated in a study of the relationship of mortality in terms of number of hours of daily sleep in the light of age (Figure Thirteen). It will be noted that the physiologic sleep period becomes more progressively critical with age as judged by the progressive sharpening of the parabola.
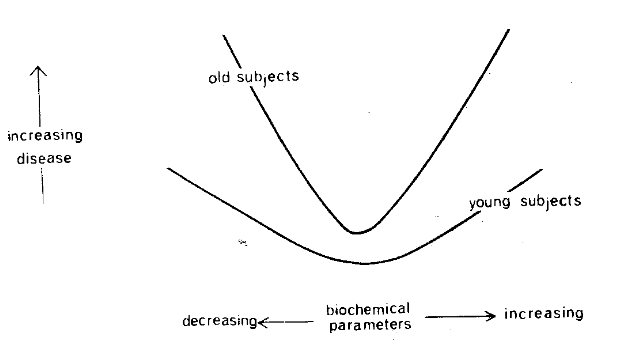
Figure Twelve. The relationship of health status and a biochemical parameter is curvilinear rather than linear as generally held. The parabolic pattern increases with advancing age.
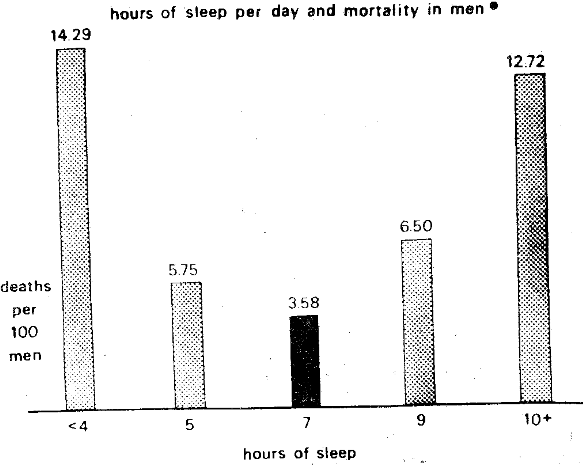
Figure Thirteen. The relationship between health status and a clinical parameter. Death and hours of sleep present a curvilinear pattern. The parabola becomes more sharply defined as age increases.
Hence, the general statement can be made that curvilinearity is not only a function of the physiologic standards but also the time factor. Parenthetic mention should be made that this is one more reason for using relatively healthy elderly persons to determine physiologic limits since these individuals are clearly proven and successful cases.
The Specificity of Tests
Earlier mention has been made that clinical disease usually begins with several seemingly unrelated and nonspecific symptoms and signs. With time, the clinical findings increase in number and begin to localize in systems, organs, and tissues. Finally, as more time elapses, as measured by months, years, or even decades, the constellation satisfies the textbook definition of a particular disease. Therefore, one of the problems in assigning a pathognomonic role to a particular test is that there is usually an arbitrary definition of what constitutes a particular disease syndrome.4
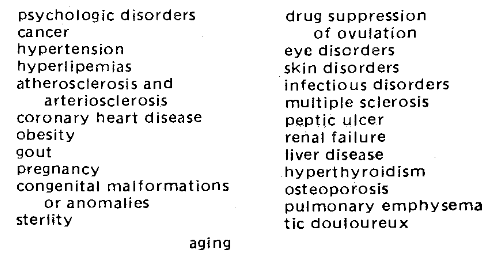
The picture is further complicated by the fact that just about every test which has been studied has been shown to be related to many different disorders. One explanation for this is that most of the prevalent chronic diseases are complex metabolic dysfunctions that affect many systems, organs, and tissues. For example, a decrease in glucose tolerance is characteristic of a score of diverse and allegedly nondiabetic syndromes (Table One). For example, a reduction in glucose tolerance, or phrased another way, an elevation in blood sugar is frequently encountered with certain psychologic disorders, in carcinomatosis, hypertension, with the hyperlipidemias, atherosclerosis and arteriosclerosis, coronary heart disease, obesity, gout, and even aging. Hence, it seems more tenable that abnormal biochemical test findings in the early ill-defined incubation stages of disease are more likely a measure of the syndrome of sickness rather than a manifestation of a sharply defined disorder.
Table One: Clinical Conditions which May Exhibit a Reduction in Glucose Tolerance
It is generally held that hyperuricemia is usually regarded in most clinical circles as pathognomonic of gout. This is particularly interesting since the uric acid level is now viewed as one of the predictive parameters in the coronary proneness profile. To enlarge upon the nonspecificity of this particular biochemical parameter, Figure Fourteen shows the relationship of serum uric acid, on the abscissa, and mean height of the P wave in Lead I on the ordinate in 72 presumably healthy subjects. First, it is important to note that the relationship is parabolic rather than linear. Thus, the highest and presumably the most abnormal P1 values, the stippled columns, parallel relatively hypouricemia and hyperuricemia. The smallest and probably most physiologic electrocardiographic value, the black bar, is found with serum uric acid levels of a magnitude of 4 to 5 mgm. per cent. Second, the relationship between serum uric acid and the mean height of P1 suggests that hyperuricemia is not exclusively associated with what is usually regarded as the classical picture of gout.
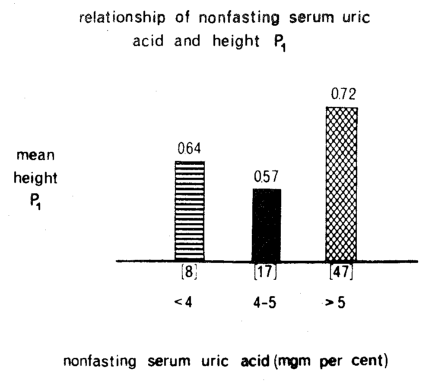
Figure Fourteen. The relationship of serum uric acid (on the abscissa) and the height of P1 (on the ordinate). The highest, and presumably the most pathologic P1 heights are noted with relative hyper- and hypouricemia. The lowest and probably the most physiologic P1 height (black column) is found in the middle range of serum uric acid. It is noteworthy that there is such a parallelism between serum uric acid and an allegedly nongout finding. This underlines the nonspecificity of serum uric acid.
To demonstrate further the nonspecificity concept, Figure Fifteen pictures serum uric acid on the horizontal axis and psychologic scores, as judged by the Cornell Word Form-2 test, on the vertical axis in the same 72 presumably healthy subjects. The earlier two conclusions obtain here. First, the relationship is curvilinear rather than linear. As a matter of fact, the highest and supposedly most pathologic psychic mean score occurs in the group with hypouricemia. Second, here is another expression of the diagnostic nonspecificity of serum uric acid since psychologic imbalance is generally not held to be part of the gout syndrome.
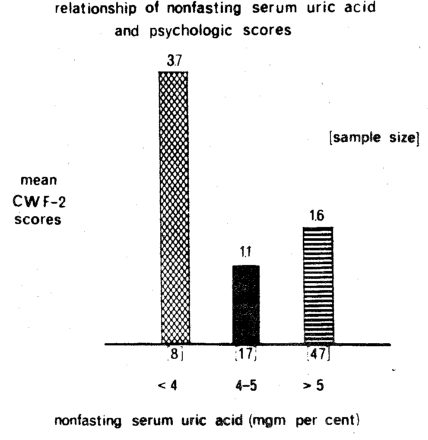
Figure Fifteen. The relationship of serum uric acid (on the horizontal axis) and psychologic scores as judged by the Cornell Word Form-2 test (on the vertical axis). The highest, and presumably the most pathologic, CWF-2 scores are noted with relative hyper- and hypouricemia. The lowest and probably the most physiologic CWF-2 score (black columns) is found in the middle range of serum uric acid. It is interesting that there is such a relationship between serum uric acid and an allegedly non-gout finding. This underscores the nonspecificity of serum uric acid.
Summary
An analysis of the periphery of man, as judged by symptoms and signs, is useful in that it provides a measure of the extent of disease. However, in itself, it has little utility in a predictive medicine program. The present methods of correlation of biochemical state versus symptoms and signs so characteristic of traditional multiple testing programs are helpful in the diagnosis of classical disease. However, the predictive potential is limited. A predictive program, to fulfill its true purpose of anticipating disease, must view the total sphere and identify the relative prognostic potential of the different interrelated layers. In this connection, in one predictive system, the concentration of serum cholesterol, for example, is a sufficient predictor of a particular disease or syndrome. However, in another predictive system, the question might rightfully be asked as what are the factors which make for hypercholesterolemia. In this type of program, the emphasis would obviously be shifted from hypercholesterolemia as a predictive tool to those factors which contribute to hypercholesterolemia such as diet, physical activity, tobacco, alcohol, and coffee and tea.
Precisely what parameter should be employed for predictive purposes is, in addition, a function of what is regarded as normal, meaning average, versus what is regarded as normal, meaning physiologic.
Further, the efficacy of predictive instrument is directly related to an awareness that many functions must be regarded in a curvilinear or trichotomy frame of reference rather than the traditional linear or dichotomy approach.
Finally, the success of predictive parameters is intimately associated with the recognition that there are no biochemical tests pathognomonic of any specific disease. Rather, biochemical procedures should be viewed, more correctly, as measures of what may be called the syndrome of sickness.
References Cited:
- Cheraskin, E. and Ringsdorf, W. M., Jr. “Predictive medicine: XI. Prognostic levels.” Amer. Geriat. Soc. 19; No. 12, 1000-1005, December 1971.
- Cheraskin, E. and Ringsdorf, W. M., Jr. “Predictive medicine: VI. Physiologic versus normal values.” Amer. Geriat. Soc. 19: No. 8, 729-736, August 1971.
- Cheraskin, E. and Ringsdorf, W. M., Jr. “Predictive medicine: V. Linear versus curvilinear function.” Amer. Geriat. Soc. 19: No. 8, 721-728, August 1971.
- Cheraskin, E. and Ringsdorf, W. M., Jr. “Predictive medicine: VII. The specificity of tests.” Amer. Geriat. Soc. 19: No. 9, 802-806, September, 1971.