Access to all articles, new health classes, discounts in our store, and more!
The Birmingham Alabama 1964 Diabetes Detection Drive: II. Age and Dextrostix Patterns
Published in The Alabama Journal of Medical Sciences, Vol. 3, No. 2, April 1966.
* * *
Introduction
The literature is replete with evidence to suggest that, in random samplings of the population, blood glucose values appear to increase with advancing age. Pozefsky, et al., (1965), Streeten, et al., (1965), Silverstone, et al., (1957), Brandt, (1960), Chesrow and Bleyer, (1954, 1955), Gottsfried, (1961), Hayner, et al., (1965), Goralon, (1964), and Spiegelman and Marks, (1946).
This report attempts to describe and analyze the significance of the age-blood glucose pattern of the 8940 participants in the November 1964 Birmingham (Alabama) Diabetes Detection Drive.
Methods and Results
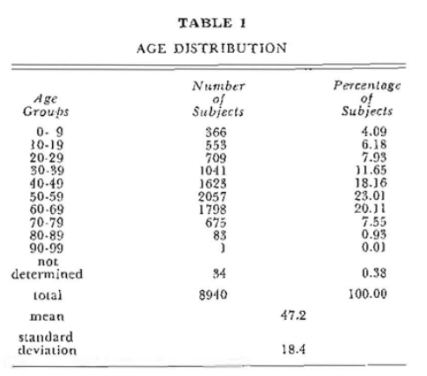
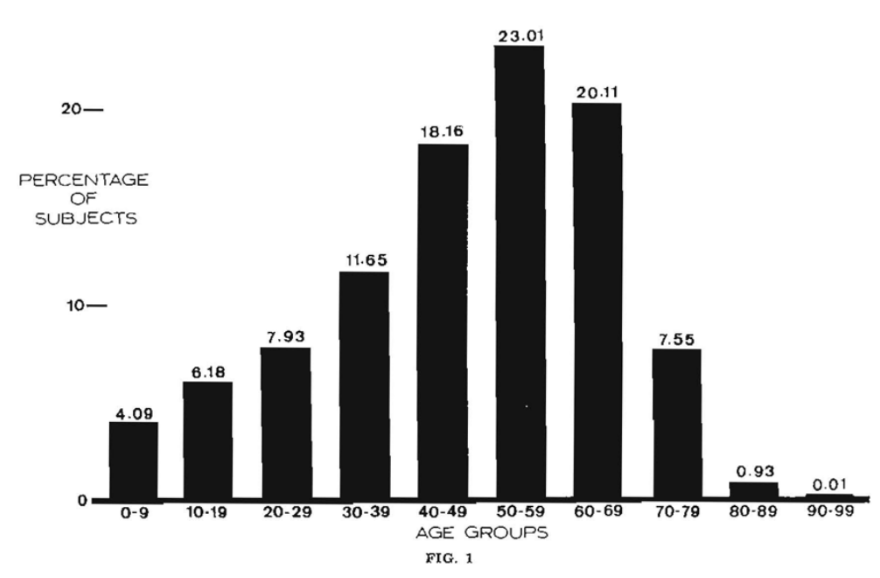
Age was recorded to the nearest whole number. Table 1 summarizes the findings. It is clear that the subjects range from the first to the tenth decade. The mean and standard deviation of 47.2±18.4 indicates that two-thirds of the entire group (specifically 68 per cent) ranged from 28.8 to 65.6 years. Finally, the greatest number of individuals (2057 or 23.01 per cent) were in the sixth decade (Figure 1).
 Capillary blood glucose was determined by the Dextrostix method (Table 2). It will be noted that the values spread from a low of 40 to a high of 250+ mg. per cent with a mean and standard deviation of 88.5± 24.9. Lastly, the greatest number of persons (2969 or 33.21 per cent) showed levels of 80-95 mg. per cent (Figure 2).
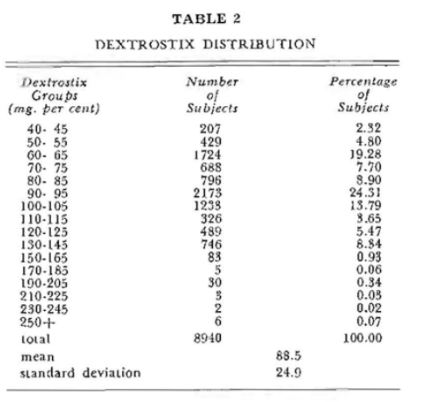
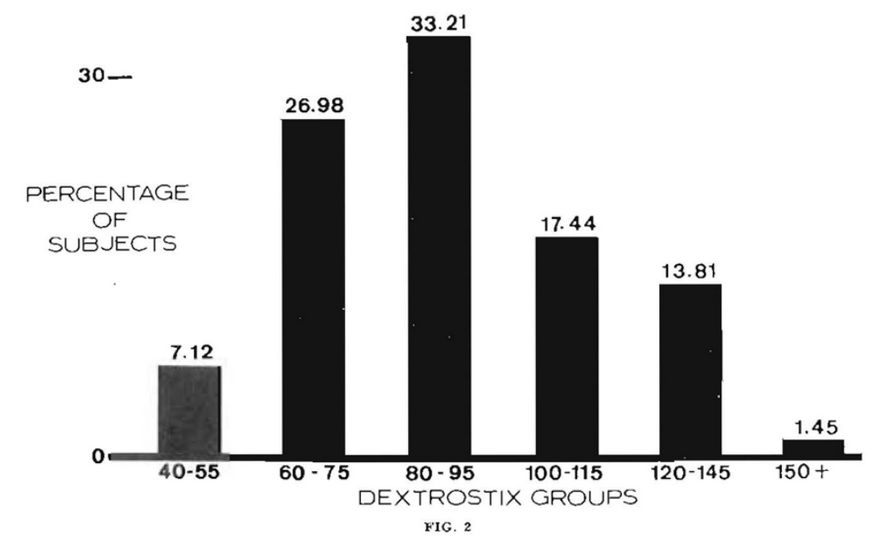
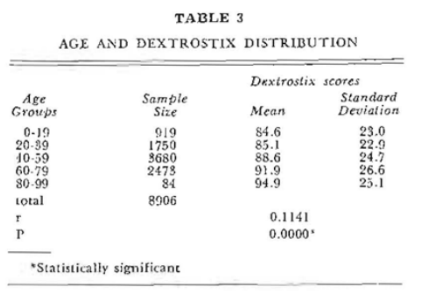
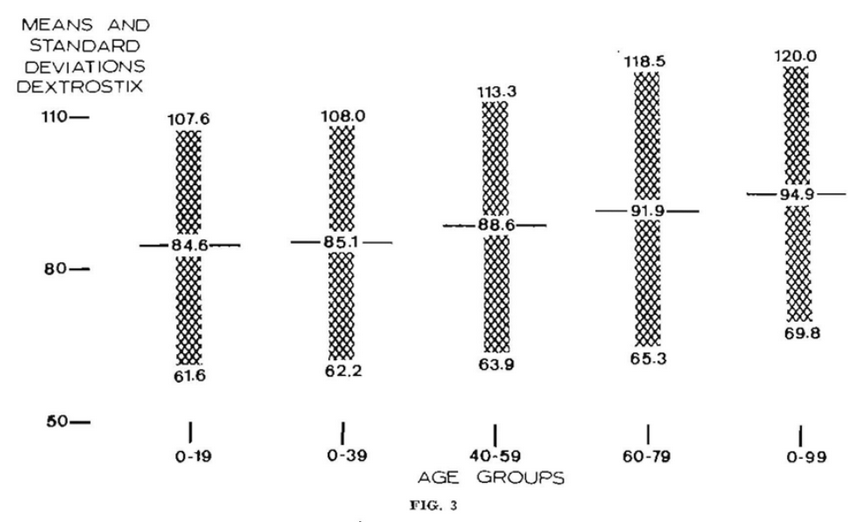
Table 3 summarizes the findings with regard to age and the blood glucose determinations. Attention is directed to the fact that, with increasing age, the mean score rises from a low of 84.6 mg. per cent in the very youngest group (0-19 years) to 94.9 mg. per cent in the oldest category (80-99 years) which is a mean difference of 12 per cent. Furthermore, and more importantly, is the fact that, with advancing age, there is a general increase in the spread as shown by the enlarging standard deviations (from 23 mg. per cent in the very youngest to 25.1 in the oldest age group). The fact that there is a significant correlation between age and blood glucose levels is shown by a coefficient of correlation of 0.1141 and a P=0.0000. Hence, irrespective of when the blood glucose determination was made in terms of when food and/or drink were last consumed, one may conclude, within the limits of these observations, that, with increasing age, there is a statistically significant rise in blood glucose scores (Figure 3).
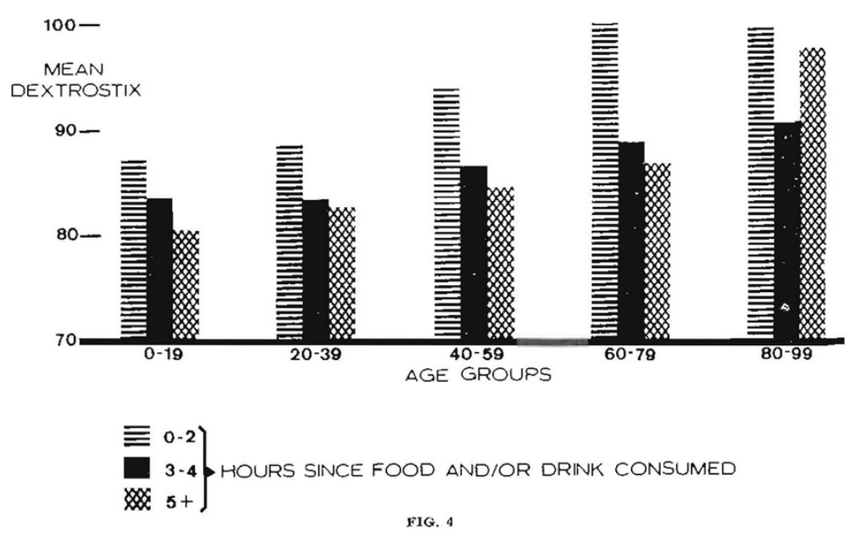
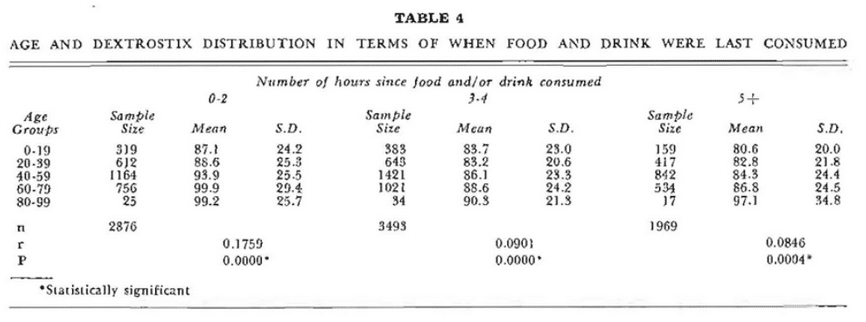
A more detailed analysis of the relationship of age to the Dextrostix values in terms of when food was last consumed is included (Figure 4). A number of points deserve special consideration. Firstly, at every temporal point there is a statistically significant relationship between age and blood glucose values (Table 4). Specifically, the P values for the correlation of age and blood glucose when taken zero to two hours (r=0.1759) after food and three to four hours after food (r=0.0901) are the same (P=0.0000). There is also a slightly less statistically significant relationship (P=0.0004) when blood glucose and age are correlated (r=0.08146) in those who were measured five or more hours after food and/or drink were taken.
Discussion
The obvious conclusion from this study (which confirms the previously well-established fact) is that mean blood glucose concentration is characteristically higher with advancing age. In contrast, scant attention has been directed to the variance of blood glucose at different ages. This relationship will be considered at this time for two reasons. Firstly, a study of variance may provide some measure of the frequency of relative hypo- as well as hyperglycemia. This information may prove useful since hypoglycemia frequently antedates hyperglycemia. Kimball, (1964), Seltzer, et al., (1956), Economon, et al., (1965), and Cerkez and Ferguson, (1965). Further, hypoglycemia is no less a pathologic sign than hyperglycemia. Secondly, an analysis of variance may contribute to the question as to whether the commonly noted progressive rise in blood glucose with advancing years is necessarily part of physiologic aging or simply evidence of increasing pathosis.
Re-examination of Table 3 shows, as previously noted, the progressive blood glucose climb with years from 84.6 to 94.9 mg. per cent (a mean difference of 12 per cent). However, it will be observed that there is also an increase in the spread of the scores from 23.0 to 25.1 mg. per cent (a rise of 9 per cent). In other words, it must be concluded that there are some elderly subjects in the 80-99 age group with blood glucose levels as low as some of the lowest observed in the youngest (0-19) age category. If one accepts the fact that the physiologic pattern for blood glucose rises with age, then hypoglycemia occurs with increasing frequency. If one argues, on the other hand, that age is not characterized by increasing blood glucose, then pathologic hyperglycemia is more common in the older subjects.
Summary
- The immediate, obvious, and consistent (in terms of other reports) observation in this study is that mean blood glucose rises with advancing age.
- The not so apparent (judging by its lack of note in published reports) additional observation is that older subjects show evidence of more reactive hypoglycemia as well as hyperglycemia.
- The enlarging variance with advancing age signifies one of two possibilities. If one holds that increasing blood glucose is not part of the phenomenon of physiologic aging, then hyperglycemia is a relatively common pathologic finding in the aging. If one grants hyperglycemia as part of the aging process, then hypoglycemia is a comparatively frequent abnormal observation.
References Cited: