
Access to all articles, new health classes, discounts in our store, and more!
Predictive Medicine VII. The Specificity of Tests
Published in Journal of The American Geriatrics Society, Vol. 19, No. 9, 1971.
* * *
ABSTRACT: In full-blown cases of disease, the results of certain biochemical tests may be highly diagnostic. However, in the early stages of illness, these tests are not pathognomonic and not even characteristic of a particular disease. For predictive purposes, biochemical testing is simply a measure of the syndrome of sickness.
“The exact contrary of what is generally believed is often the truth.” – Jean de la Bruyere
In earlier reports we have developed the philosophy of predictive medicine1 and have described some of the unique features2-6 that set it apart from traditional medicine. The purpose of this report in the series is to consider whether specific testing procedures are pathognomonic or characteristic of disease. For example, the glucose tolerance test is usually regarded as pathognomonic in diabetes mellitus, and the serum uric acid level as a specific indicator in gout.
As discussed previously,4 disease usually begins with few and seemingly unrelated and nonspecific symptoms and signs. With time, the clinical findings increase in number and begin to localize in systems, organs and other sites. With more time (usually expressed as age), the constellation satisfies the textbook definition of a particular disease. Therefore, one of the problems in assigning a pathognomonic role to a particular test is the arbitrary definition of what constitutes a particular disease syndrome.
A further complication is that almost every test gives findings that can be related to many different disorders. For example, a decrease in glucose tolerance is characteristic of many diverse and allegedly nondiabetic syndromes (Table 1).7 Hence, it seems more tenable that abnormal biochemical findings in the ill-defined incubation stages of disease are more likely to be a measure of the syndrome of sickness than of a specific, sharply defined disorder.
Table 1–Clinical States in Which Glucose Tolerance May Be Reduced
| Psychologic disorders
Cancer Hypertension Hyperlipemia Atherosclerosis and arteriosclerosis Coronary heart disease Obesity Gout Pregnancy Congenital malformations or anomalies Sterility Drug suppression of ovulation Eye disorders Skin disorders Infectious disorders Multiple sclerosis Peptic ulcer Renal failure Liver disease Hyperthyroidism Osteoporosis Pulmonary emphysema Tic douloureux Aging |
Serum Uric Acid in Relation to Factors Other Than Gout
Hyperuricemia is usually regarded as pathognomonic of gout. Figure 1 emphasizes the nonspecificity of this particular biochemical measurement, by showing the parabolic relationship of the serum uric acid level to the height of the electrocardiographic P1 wave in 72 presumably healthy nonfasting subjects.8 The highest, and supposedly the most pathologic P1 waves (cross-barred columns) were associated with both hypouricemia and hyperuricemia. The smallest P1 waves, and probably the most physiologic (black column), were associated with the intermediate range of serum uric acid values, i.e., 4-5 mg per 100 ml. This is consistent with our earlier studies5 showing curvilinear rather than linear parallelisms. Also, the relationship between serum uric acid and the height of the P1 waves indicated that the concentration of serum uric acid is not exclusively related to what is usually regarded as the classic picture of gout.
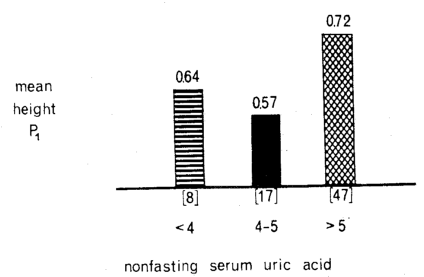
Fig. 1. The relationship of serum uric acid concentration (mg/100 ml) and the height of the electrocardiographic P1 wave in 72 presumably healthy nonfasting subjects–a “non-gout” situation. The highest, and supposedly the most pathologic, P1 waves (cross-barred columns) were associated with both hypouricemia and hyperuricemia. The lowest, and probably the most physiologic, P1 waves (black column) were associated with the middle range of serum uric acid values. This emphasizes the nonspecificity of serum uric acid determinations.
In Figure 2, serum uric acid levels are shown in relation to psychologic scores (as judged by the Cornell Word Form-2 test) in the same 72 presumably healthy nonfasting subjects.8 The relationship is curvilinear rather than linear. The highest, and supposedly the most pathologic, CWF-2 scores occurred in the group with hypouricemia. Since the psychologic state is not regarded as part of the gout syndrome, this is another example of the nonspecificity of the serum uric acid determination.
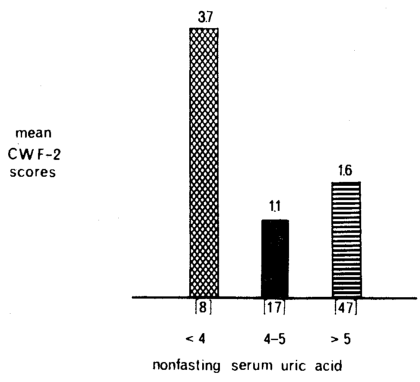
Fig. 2. The relationship of serum uric acid concentration (mg/100 ml) to psychologic scores as judged by the Cornell Word Form-2 test in 72 presumably healthy nonfasting subjects–a “non-gout” situation. The highest, and supposedly the most pathologic, CWF-2 scores (cross-barred columns) were associated with both hyperuricemia and hypouricemia. The lowest, and probably the most physiologic, CWF-2 scores (black column) were associated with serum uric acid values in the middle range (4-5 mg/100 ml). This emphasizes the nonspecificity of serum uric acid determinations.
Serum Triglycerides in Relation to Noncardiac Syndromes
At present our major concern is the coronary proneness profile. Abnormal levels of serum cholesterol and triglycerides are recognized as predictors of coronary artery disease. The implication is that these two measures of lipid metabolism are exclusively involved in cardiac disease. That this implication is not valid is demonstrated in the following two observations:8
Figure 3 shows the relation between serum triglyceride levels and the number of reported gastrointestinal findings in 100 apparently healthy nonfasting subjects. The highest gastrointestinal scores (cross-barred columns) were associated with both hyper- and hypotriglyceridemia, and the lowest scores (black column) with the intermediate triglyceride values. The relationship was parabolic. Thus serum triglyceride levels even might be useful in the early detection of gastroenteric problems.
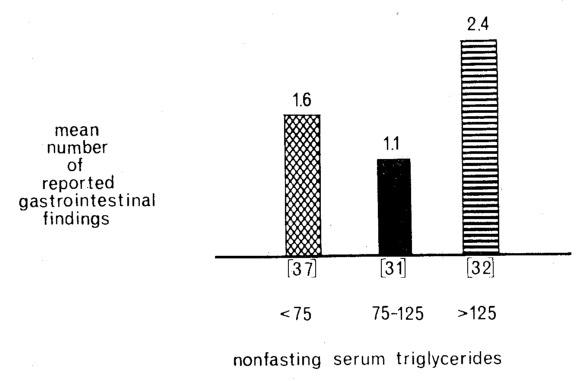
Fig. 3. Relationship of the level of serum triglycerides (mg/100 ml) to the number of reported gastrointestinal findings in 100 supposedly healthy nonfasting subjects–a “noncardiac” situation. The greatest numbers of gastrointestinal findings (cross-barred columns) were associated with both hyper- and hypotriglyceridemia. The lowest number of gastrointestinal findings (black column) was associated with the middle range of serum triglyceride values. This emphasizes the nonspecificity of serum triglyceride determinations.
Figure 4 shows the level of serum triglycerides in relation to the reported number of respiratory symptoms and signs in the same group of 100 persons. Again, the relationship was curvilinear rather than linear.
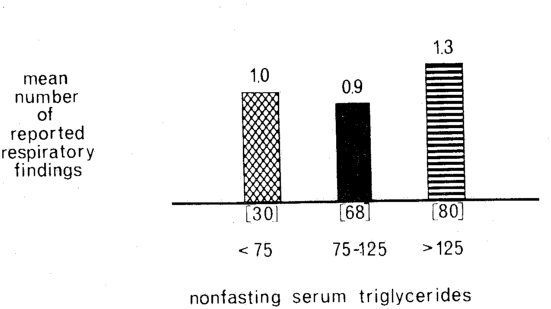
Fig. 4. The relationship of serum triglycerides (mg/100 ml) to the number of reported respiratory findings in 100 supposedly healthy nonfasting subjects–a “noncardiac” situation. The greatest numbers of respiratory findings (cross-barred columns) were associated with both hyper- and hypotriglyceridemia. The lowest number of respiratory findings (black column) was associated with the middle range of serum triglyceride values. This emphasizes the nonspecificity of serum triglyceride determinations.
As noted by Ishmael,9 hypertriglyceridemia is a feature not only of atherosclerosis but of the genetically associated disorders–gout, diabetes and obesity.
References Cited:
- Cheraskin, E., and Ringsdorf, W. M., Jr.: “Predictive medicine. I. Definitions,” Alabama J. Med. Sc. 7: 444 (Oct.) 1970.
- Cheraskin, E., and Ringsdorf, W. M., Jr.: “Predictive medicine. II. Experimental models,” J. Am. Geriatrics Soc. 19: 448 (May) 1971.
- Cheraskin, E., and Ringsdorf, W. M., Jr.: “Predictive medicine. III. An ecologic approach,” J. Am. Geriatrics Soc. 19: 505 (June) 1971.
- Cheraskin, E., and Ringsdorf, W. M., Jr.: “Predictive medicine. IV. The gradation concept,” J. Am. Geriatrics Soc. 19: 511 (June) 1971.
- Cheraskin, E., and Ringsdorf, W. M., Jr.. “Predictive medicine. V. Linear versus curvilinear functions,” J. Am. Geriatrics Soc. 19: 721 (Aug.) 1971.
- Cheraskin, E., and Ringsdorf, W. M., Jr.: “Predictive medicine. VI. Physiologic versus normal values,” J. Am. Geriatrics Soc. 19: 729 (Aug.) 1971.
- Cheraskin, E., and Ringsdorf, W. M., Jr.: “Diabetic dilemma in dentistry,” Acta Diabet. Latina (in press).
- Unpublished data, Department of Oral Medicine, University of Alabama Medical Center, Birmingham, Alabama.
- Ishmael, W. K.: “Atherosclerotic vascular disease in familial gout, diabetes and obesity,” Med. Times 94: 157 (Feb.) 1966.