
Access to all articles, new health classes, discounts in our store, and more!
Operation Human Guinea Pig
Published in The Journal of Applied Nutrition, Vol. 12, No. 3, 1959.
* * *
Introduction
One might suspect, from the title of this report, that herein is a tale about human beings who have been studied under some type of experimental situation. This is not at all true. The fact of the matter is that here is a story of guinea pigs who have been treated like human beings. Specifically, this is a study of the problem of ascorbic acid deficiency in the guinea pig.
One might wonder why such a study is at all warranted. The literature is replete with numerous studies of the ascorbic acid requirements of the guinea pig. This investigation has been undertaken for the following reasons:
- The evidence available from the literature suggests that the scorbutic changes in the human being closely parallel the findings in the guinea pig.1,2,3 It is conceivable, then, that the more information derived from guinea pig research, the more data will be available for translation to the human being.
- The available evidence from the literature indicates that the ascorbic acid requirement for the guinea pig varies with the criterion or criteria employed.4-37 At the present time, guinea pig requirements are based largely upon macroscopic (e.g. weight) and microscopic (e.g. odontoblastic) signs. It would be highly desirable to gather new criteria, to determine if these new yardsticks confirm or negate the present standards.
- Most of the available evidence from the literature is based upon comparative studies of completely scorbutic animals versus control (presumably healthy) groups. Though this experimental approach is interesting and revealing, the clinician is unable to use such data because, seldom if ever, does he encounter a classical case of human scurvy. It would, therefore, be desirable, if possible, to produce in a guinea pig a scorbutic state which more closely simulates the state of affairs encountered in clinical practice.
With these thoughts in mind, the following plan was evolved: (1) a review of the available literature regarding the presently accepted ascorbic acid standards of the guinea pig, and (2) a study of the guinea pig ascorbic acid requirement based upon a new, yet simple criterion which would be clinically adaptable.
Review of the Literature
In the past half century, numerous attempts have been made to establish the ascorbic acid needs of the guinea pig. In the main, the experiments have been based upon the observations in the 250-350 gram group. The criteria for protection against scurvy have been quite varied and include: (1) macroscopic signs, (2) microscopic signs, (3) tissue saturation, (4) wound healing, (5) bone regeneration, (6) gastrocnemius strength, (7) serum phosphatase, (8) survival, (9) reproduction, and (10) adrenal weight.
Macroscopic Signs
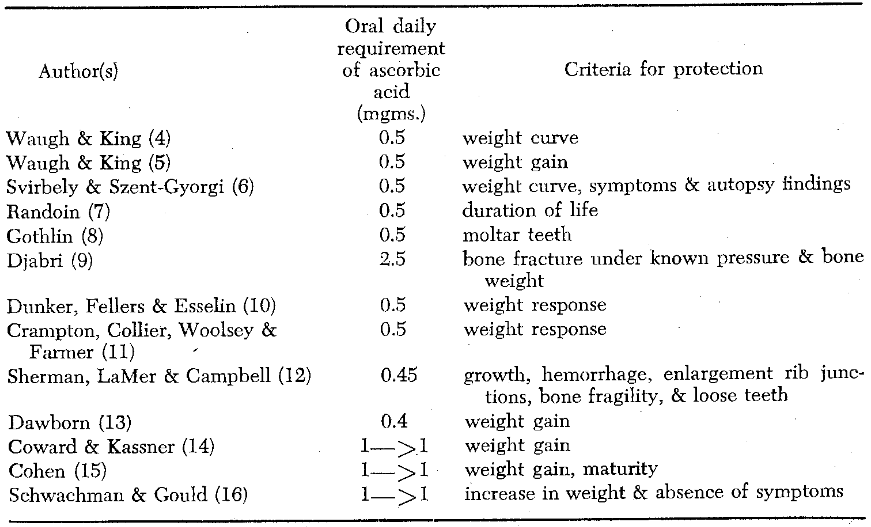
A number of investigators have developed ascorbic acid requirements based upon how much of the vitamin is required to protect the animal against gross scorbutic changes (Table 1). It can be seen that the specific criteria include weight gain, bone fragility, loose teeth, and hemorrhage. One can conclude from Table 1 that, in the main, gross scorbutic manifestations can be prevented satisfactorily with approximately 0.5 to 1.0 mgm. of ascorbic acid administered daily by mouth to the 250-350 gram guinea pig.
Table 1–Ascorbic acid requirements to protect the 250-350 gram guinea pig against macroscopic evidence of scurvy
Microscopic Signs
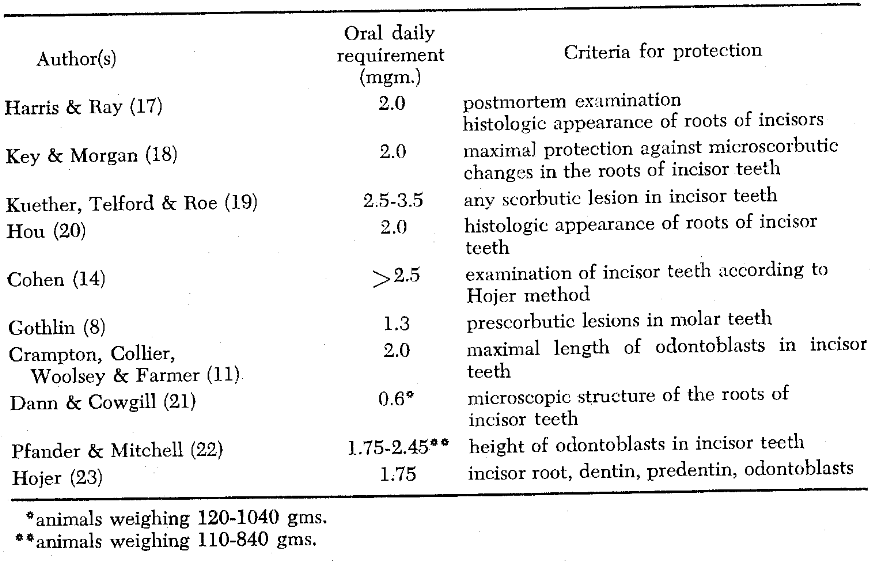
A number of researchers have set forth ascorbic acid requirements based upon how much of the vitamin is required to protect the animal against microscopic scorbutic alterations (Table 2). Once again, it is clear that the specific standards vary. Most of the criteria center about a histologic appraisal of the odontoblasts, dentin, and/or predentin. Two points are worthy of mention: (1) the requirements offered as protection against microscopic alterations are less agreed upon than those aborting macroscopic scurvy, and (2) the dosages, which prevent micropathology, exceed, by up to seven times, those set forth to forego gross changes.
Table 2–Ascorbic acid requirements to protect the 250-350 gram guinea pig against microscopic evidence of scurvy
Tissue Saturation
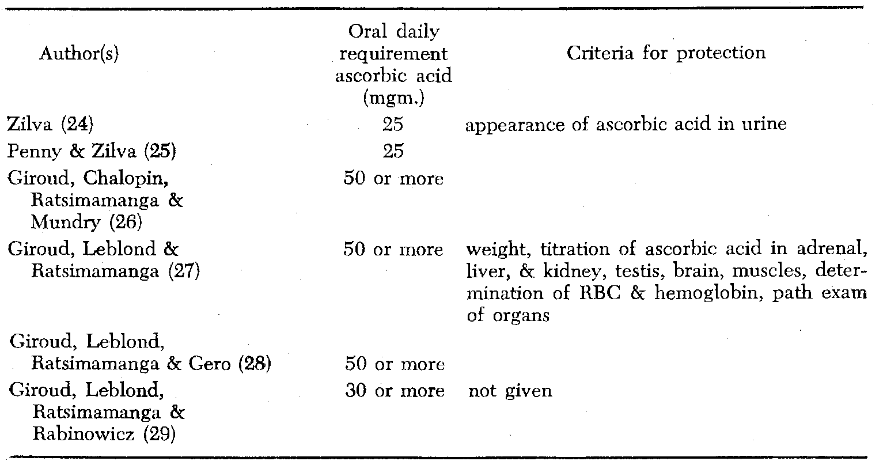
Limited studies have been performed to establish how much ascorbic acid is required to saturate various tissues (Table 3). An examination of this chart shows that different investigators have established different requirements. The standards vary from 50 to 100 times the amount necessary to protect the animal against macroscopic scurvy and from 10 to 20 times the quantity required to prevent microscopic signs of scurvy.
Table 3–Ascorbic acid requirements to produce tissue saturation in the 250-350 gram guinea pig
Miscellaneous Criteria
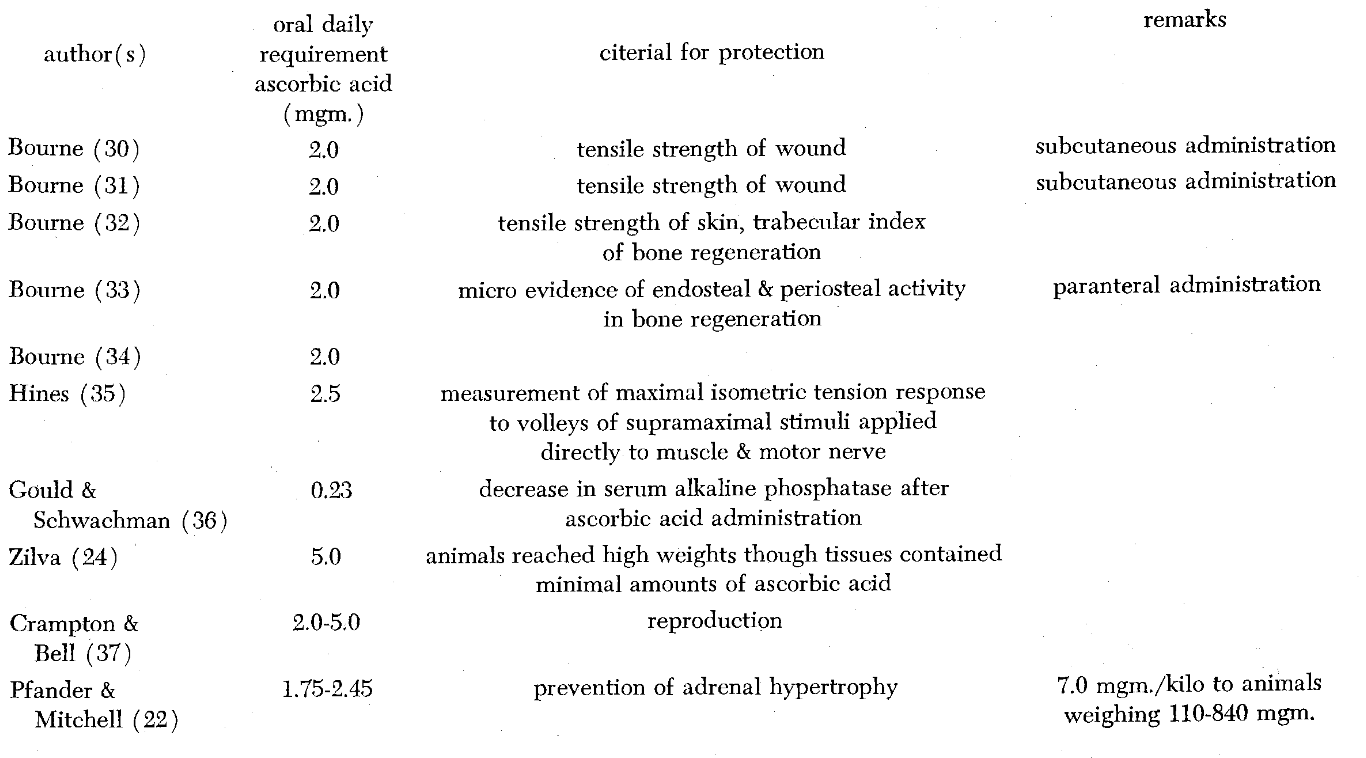
Finally, other criteria have been utilized to determine ascorbic acid needs of guinea pigs, such as wound healing, bone regeneration, gastrocnemius strength, serum phosphatase, survival, reproduction, and adrenal weight (Table 4). These recommendations vary from as little as 0.23 mgm. daily (less than the amount required to protect the animal against macroscopic scurvy) to 5.0 mgm. (an amount twice that necessary to forestall microscopic scorbutic changes).
Table 4–Ascorbic acid requirements to protect the 250-350 gram guinea pig against miscellaneous evidence of scurvy
Summary
The review of the literature may be summarized in the following statements.
- The ascorbic acid requirements set forth for the guinea pig vary widely.
- As criteria become finer, requirements increase.
- Most of the criteria employed, with the exception of weight, are complex and not adaptable to human study.
Method of Investigation
Thirty guinea pigs, ranging in weight from 359 to 600 grams*, were caged. They were allowed five days in which to adjust to the new environment. The experiment proper began on the sixth day and continued through the thirty-second day. Thus, the animals were on experiment for twenty-six days. Four animals died during this period.
The guinea pigs were divided into six groups of five animals each, based upon graded intakes of ascorbic acid:
GROUP A. Each animal received a scorbutic diet ad libitum throughout the experimental period.
GROUP B. Each animal received a scorbutic diet ad libitum throughout the experimental period. In addition, each animal was given a daily subcutaneous injection of 5 mgm. of ascorbic acid per kilogram. In other words, the average vitamin supplementation for this group was 2.4 mgm. per animal per day.
GROUP C. Each animal received a scorbutic diet ad libitum through the experimental period. In addition, each animal received a subcutaneous daily injection of 10 mgm. of ascorbic acid per kilogram. In other words, the average animal received a daily ascorbic acid dose of 5.2 mgm.
GROUP D. Each animal received a scorbutic diet ad libitum throughout the experimental period. In addition, each animal received a subcutaneous daily injection of 15 mgm. of ascorbic acid per kilogram. In other words, each animal received a daily ascorbic acid dose of 7.3 mgm.
GROUP E. Each animal received a scorbutic diet ad libitum throughout the experimental period. In addition, each animal received a subcutaneous daily injection of 20 mgm. of ascorbic acid per kilogram. In other words, each animal received a daily ascorbic acid dose of 8.9 mgm.
GROUP F. These animals served as the control group. Each animal consumed, ad libitum, the diet customarily prescribed for the normal maintenance of such animals.
Each animal was weighed daily. The amount of ascorbic acid to be administered was determined by the initial weight of each animal. This was done in an attempt to simulate human experience where, should an individual lose some weight, he would ordinarily not reduce his ascorbic acid intake.
A simple criterion of the degree of scorbutus was chosen. It was felt that alveolar bone height would be a suitable index. It was developed as follows:
On the 32nd day (the 26th day of the experiment) all the animals were sacrificed. The skulls were cleaned and roentgenograms taken of the mandible under standard conditions. Photographs were taken of these radiographs at a 4X magnification (Figs. 1 and 2). The distance from the occlusal surface of the first molars to the alveolar bone was measured with calipers. Since the magnification was 4X, 4 mm. on the photograph was equivalent to 1 mm. on the actual animal jaw. Reading was possible to the nearest 0.5 mm. Thus, in terms of actual jaw distances, bone level was measured to the nearest 0.125 mm. The distance from the occlusal surface to the alveolar bone (in millimeters) on the photographs will serve as the index of alveolar bone height.** As the index value increases, the alveolar bone level is actually decreasing. Thus, the higher the value, the greater the bone loss.
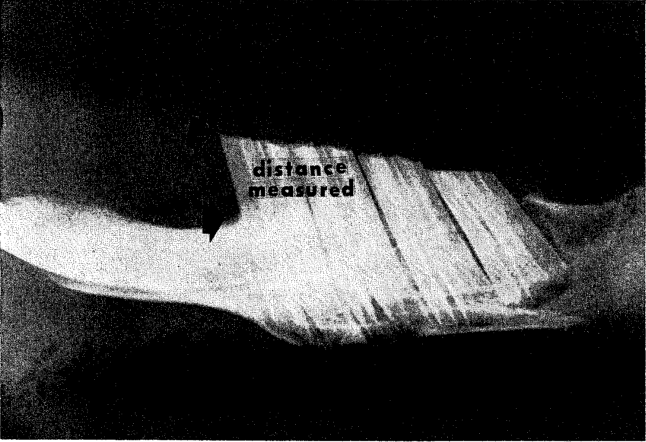
Fig. 1. Roentgenogram of the jaw of a completely scorbutic animal (Group A).
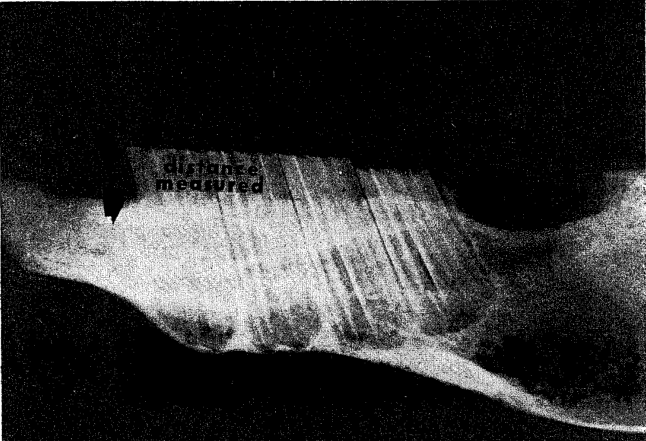
Fig. 2. Roentgenogram of the jaw of a control animal (Group F).
This method of estimating bone level was checked by two other systems: (1) the roentgenograms proper were projected onto a screen. The distance from the occlusal surface of the first molars to the level of alveolar bone was recorded. Since the film was magnified 56 times, one inch on the screen was equivalent to 0.45 mm. of actual jaw length, and (2) with the same roentgenograms projected on the screen, an alveolar bone index was established as a ratio of the occlusal-surface-to-alveolar-bone distance and the length of the tooth. It is noteworthy that all the indices correlated highly with one another and that they yielded almost identical results when one was substituted for another in various statistical procedures.
Summary of Method
There are two aspects of the above method which are suggestive in terms of human applicability:
- The group arrangement into graded intakes of ascorbic acid was such as to simulate the human experience. By this means, it was hoped that one could detect the animals with subclinical as well as classical scurvy.
- The scorbutic index (alveolar bone level as measured from mandibular roentgenograms) which was employed may be a useful detector of human scurvy.
Results
The observations will be considered in two categories: (1) group weight changes and (2) group patterns of alveolar bone height.
Weight Response
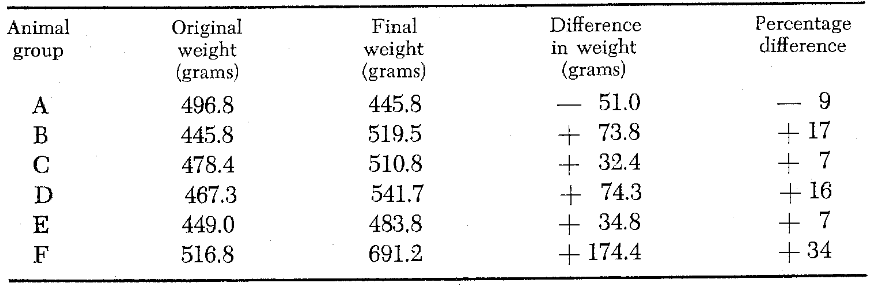
Table 5 depicts weight changes of all animal groups. It is clear from this chart that the completely scorbutic animals (Group A), weightwise, fared worse than any other group. Group A shows a final weight loss of 9 percent. At the other extreme, it is evident that the control animals (Group F), on a weight basis, fared best as evidenced by an overall weight gain of 34 percent. The intermediate categories (Groups B, C, D, E) are also depicted in Table 1. It is evident that all of these animals gained weight ranging from 7 to 17 percent of the original weight.
Table 5
Alveolar Bone Level
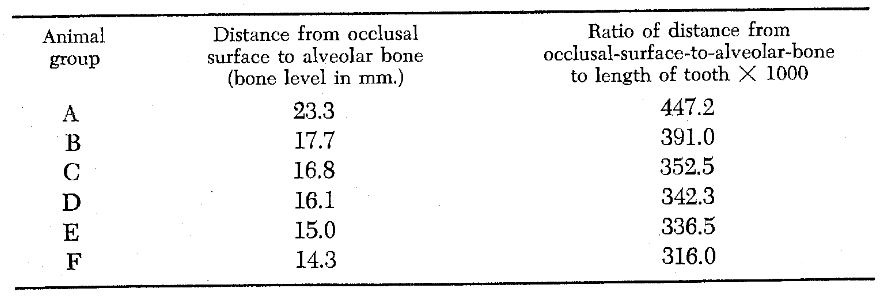
Table 6 depicts the mean alveolar bone level of each group of animals. The greater the value the greater the bone loss. It is clear from this chart that the completely scorbutic animals (Group A), on the basis of alveolar bone level, fared worse than any other group. Specifically, the values for this group were 23.3 and 447.2. On the other hand, an examination of alveolar bone level in the control category (Group F) showed average values of 14.3 and 316.0. In other words, the animals in this group demonstrated the least alveolar bone loss. Finally, Table 6 clearly shows that the intermediate groups (B, C, D, E) with increasing ascorbic acid intake demonstrated decreasing amounts of bone loss.
Table 6–Comparison of alveolar bone level by two different roentgenographic methods
Discussion
What normal should mean has been a perennial plague. One reason for this is that the term is often used abstractly and generally, apart from specifically defined biologic circumstances. Although normal, in this sense, is a sort of physiologic ideal, it cannot be known in practice. Utility demands measurable events. The poetic or ideal normal is rejected in favor of specific circumstance. This obviously limits the health researcher to the concept that health equals absence of disease, for only disease is recognizable. Health does not currently have independent positive expressions.
In research, then, an organism is healthy unless the contrary can be exhibited. This attitude maintains an objectivity and singularity when dealing with normal. Normal is no longer an all-encompassing teleologic ideal but is single and visible. Thus, one may say “normal in this or that respect” rather than “normal” alone.
This preface has implications in experiments dealing with the ascorbic acid requirements of guinea pigs. From Table 1, it is clear that weight protection has been a popular criterion of the absence of disease. The almost unanimous decision of these authors is that 0.5 mgm. of ascorbic acid per day is adequate to guard the normality of the 250-350 gram guinea pig. Normality is, of course, absence of weight loss. Table 2 exhibits proposed daily guinea pig needs based upon more subtle protection. The one obvious feature of this chart is that all the proposed criteria call for greater daily increments of ascorbic acid than the criterion of weight. Table 3 lists saturation requirements. What saturation might imply in terms of health or disease is not clear and will not be pursued here. The criteria in Table 4, with the exception of serum phosphatase,36 call for greater daily ascorbic acid intakes than those in the two previous tables. It is interesting that Zilva24 recommended 5 mgm. per day to enhance survival and Crampton and Bell37 up to 5 mgm. per day for optimal reproduction.
It is pertinent to ask which of the offered dosages is correct in terms of optimal well-being of a guinea pig. The answer could be a question of well-being with regard to a specific criterion. However, it seems reasonable that the whole organism would function best if all known criteria were being considered. In other words, by administering the highest recommended dosage, one would be safe in respect to all known criteria. This is, of course, with an added safety factor, the basis of the human recommended intake. In observing a specific event as representative of disease or health, one could accurately and confidently define a minimal dosage, if it could be shown that graded dosages of the vitamin produced graded expressions of that event. The minimal point or dosage would be, mathematically, the point at which increased dosage no longer produced improvement of the particular event.
Weight gain is a popular event in the definition of health, particularly in the young (approximately 250 gram) animal. None of the authors (Table 1) employed older, and therefore heavier, animals. However, it is felt that, even though older animals (greater than 350 grams) comprised this study, an analysis of weight gain as a criterion might prove valuable. At the same time, an interesting contrast may be evident if alveolar bone level is viewed alongside weight gain during the analysis.
Variability of Weight Gain Versus Alveolar Bone Level
Low variability is a desirable property of any disease index. The comparative variability of weight gain versus alveolar bone height may be viewed numerically in Table 7 by contrasting coefficients of variation. The lower the value of the coefficient of variation, the less is the variability of the index. The inherent variability of each criterion may also be viewed graphically by reference to Figs. 3, 4, and 5. From Fig. 3, it is obvious that weight gain is a highly fluctuant series. Conversely, alveolar bone loss (Fig. 4) expresses a strong central tendency. In other words, within any one group, animals tended to be more alike with respect to bone height and less alike with respect to weight gained. Therefore, with regard to variability, alveolar bone height is a more acceptable standard than weight gain. Figure 5 is a composite of the two curves.
Table 7–The variability in weight response versus alveolar bone height
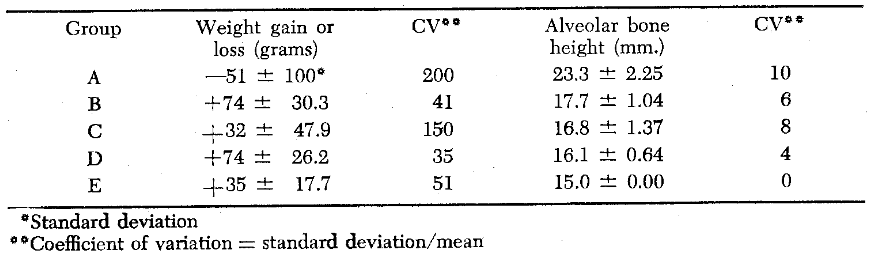
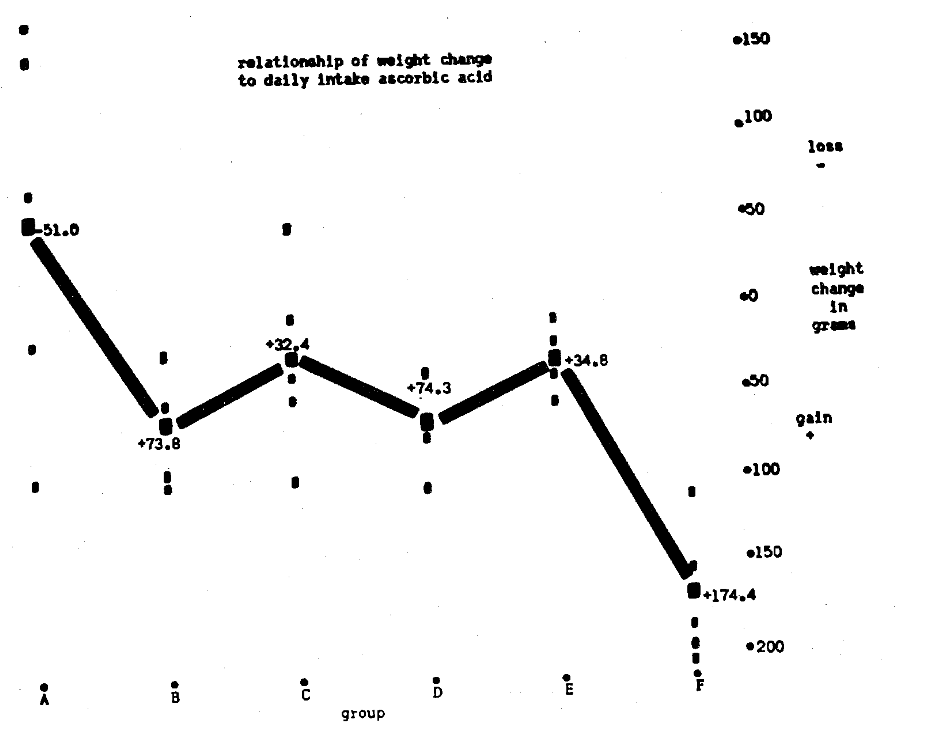
Fig. 3
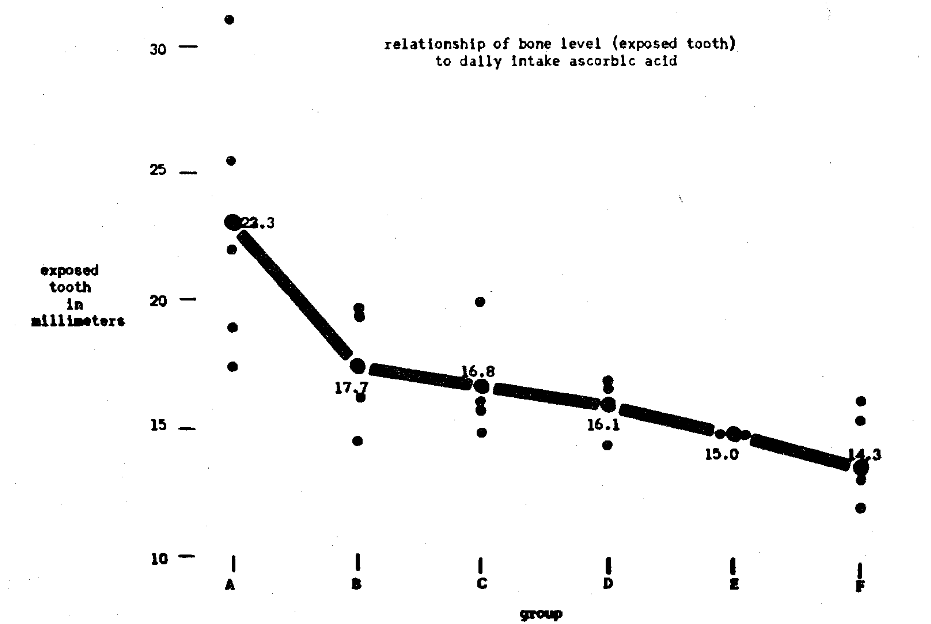
Fig. 4
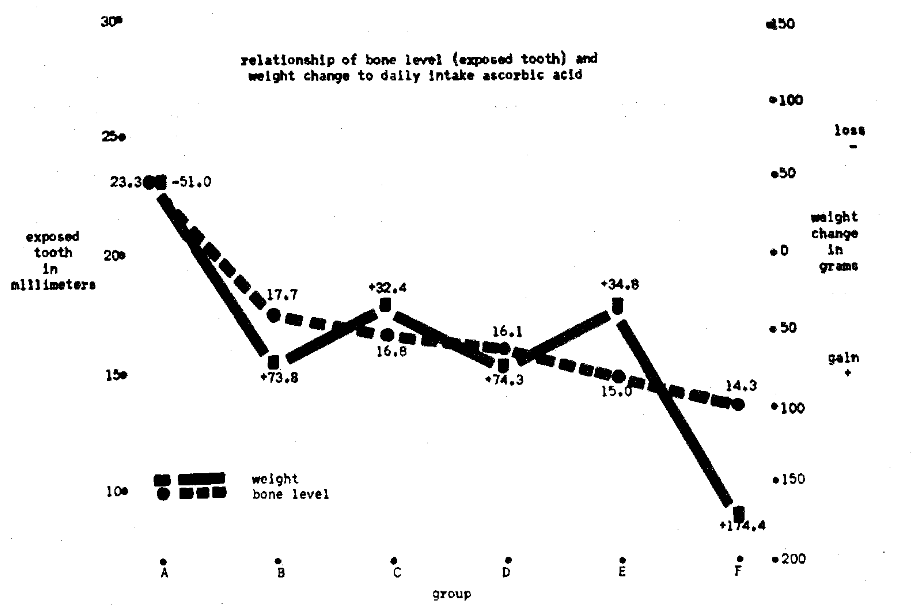
Fig. 5
Dosage Regression in Weight Response Versus Alveolar Bone Level
Which criterion, if either, might better serve to predict intake? Or, put another way, which event more closely parallels the ascorbic acid dosage? The higher the degree of association of event with dosage, the greater its acceptability as a standard of ascorbic acid health. Again, Fig. 3 may be consulted in visualizing these relationships.
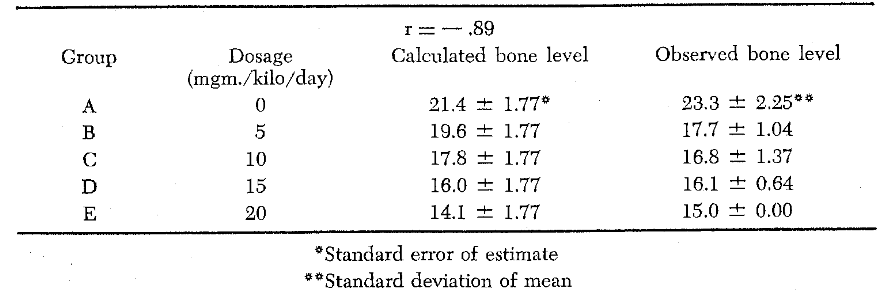
Table 8 outlines the degree of statistical parallelism as contrasting coefficients of correlation. Within the limits of this study, weight appears to be a useless criterion–i.e., if known dosage of ascorbic acid is any measure of ascorbic acid status. And, of course, this is an accepted research axiom. Weight, then, will be abandoned as a useful criterion of health in these adult animals. It now remains to judge the usefulness of the criterion of alveolar bone level. The first approach is to estimate the linearity of relationship of bone level versus dosage. Figure 6 portrays this relationship along with the error of estimate (one standard deviation of observed bone level from calculated bone level). Table 9 shows the usefulness of dosage as linearly predictive of bone level by comparing the observed with the calculated bone loss.
Table 8
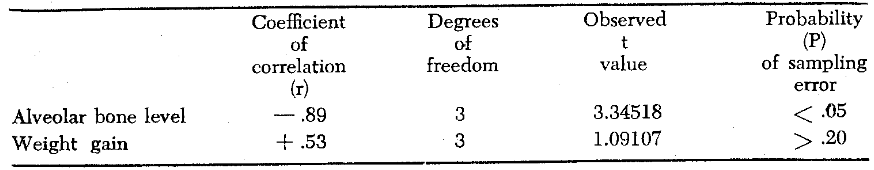
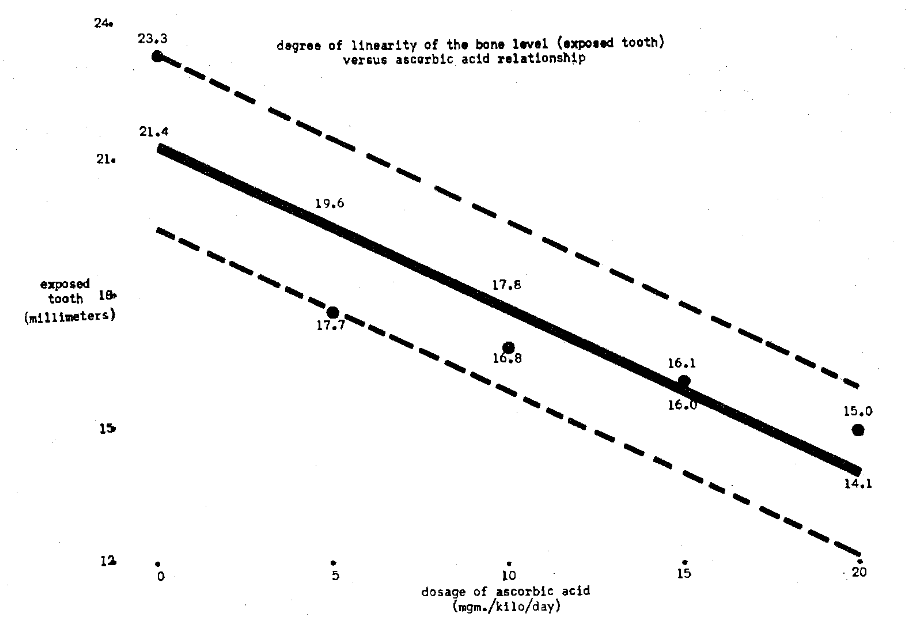
Fig. 6
Table 9
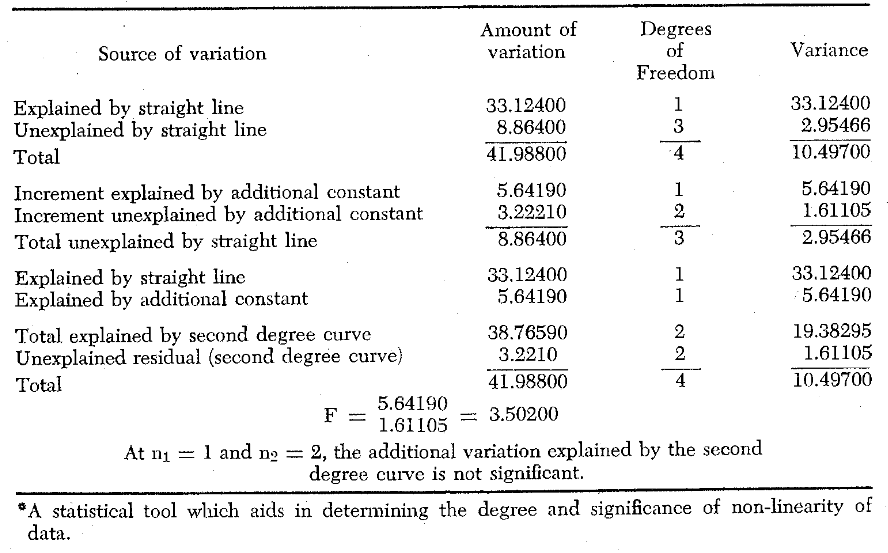
To check whether linearity is the best function, the mean group alveolar bone level data were formed into a second degree curve (vertical parabola). The utility of this relationship is exhibited in Table 10. It is clear that the second degree curve, as judged from the error of estimate, fits the data more closely. This is confirmed graphically in Fig. 7. Although, as shown in Table 11 (an analysis of variance) the data did not differ significantly from a line, the obvious improvement of all parameters following the fitting of a parabola imply that the only fault lay in too few observations (low degrees of freedom). The correlational parameter increased from -.89 (Table 9) to. 96 (Table 10) and the standard error of estimate decreased from 1.77 to .64, in changing from linearity to curvilinearity.
Table 10
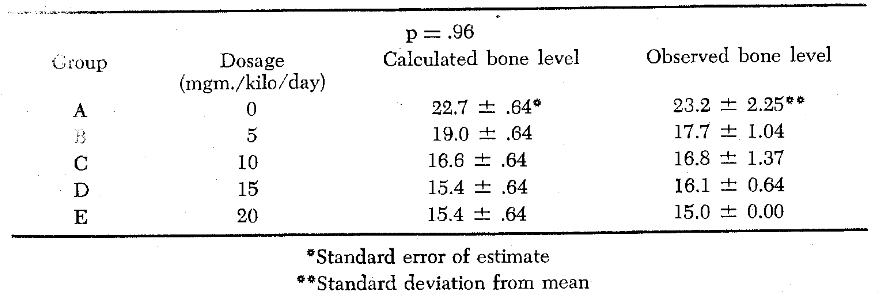
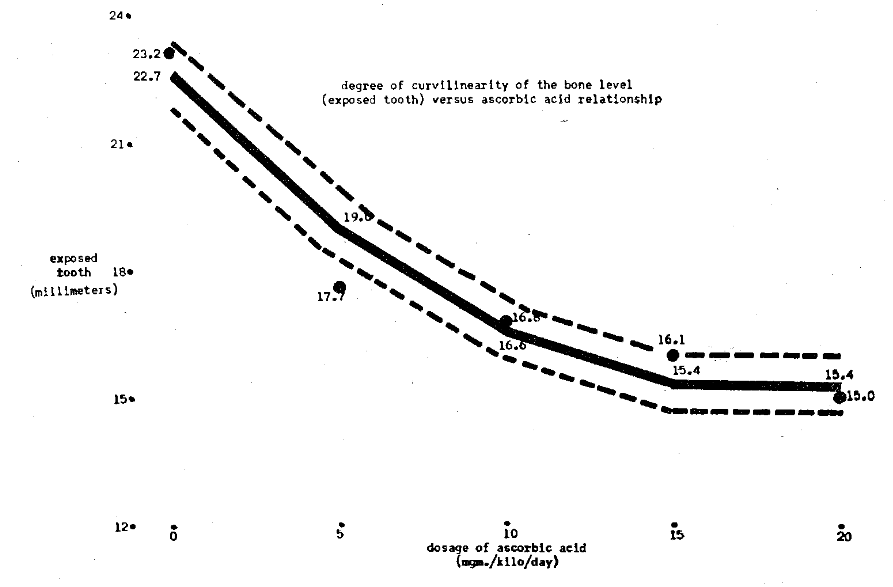
Fig. 7
Table 11–Analysis of Variance
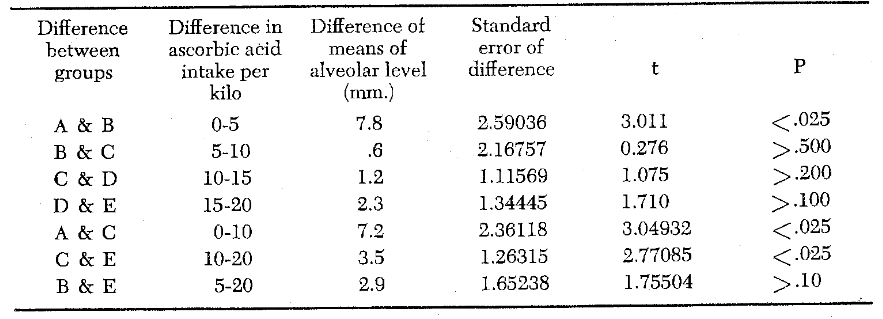
The foregone mathematical manipulations suggest a useful relationship between bone level and ascorbic acid status. It remains, then, to estimate the implications of this relationship in terms of a dosage which will maintain maximal bone level. The first step in this analysis is to judge whether the various dosages differed significantly from one another. Table 12 lists these findings. Briefly, the completely scorbutic animals (Group A) differed from the rest. Groups B, C, and D did not differ from each other, while Group E tended to be distinct. In short, three general dosage levels were detected; on the basis of significance of changes wrought: (1) 0 mgm. per day, (2) 2.4-7.3 mgm. per day, and (3) 8.9 mgm. per day. These dosage levels represent the intake of the average animal in each category. The average animal of the first category (Group A) weighed 496 grams, while the second (Groups B, C, and D) and last categories (Group E) had average weights of 463 and 449 respectively. Thus, dosage levels may also be stated as weight equivalents: (1) 0 mgm./kilogram/day, (2) 5-15 mgm./kilogram/day, and (3) 20 mgm./kilogram/day.
Table 12
Since the parabolic function of dosage versus alveolar bone level tends to peak at Group D and since Groups D and E do not differ significantly from each other, it seems that a dosage between 15 and 20 mgm. per kilogram is the daily allowance which is associated with the highest level of alveolar bone. In non-weight terms, the protected animals were receiving from 7.3 to 8.9 mgm. of ascorbic acid per day. This dosage exceeds those based upon prolonged suivival24 and upon reproduction,37 the highest recommended dosages previously reported.
One facet of the study which demands attention is the behavior of the control animals. This group (F), although consuming surely less ascorbic acid than Groups D and E, nevertheless exhibited a greater bone level. This observation points up an oversight of the study. Actually, Group F should also have received a scorbutogenic diet plus ad libidum ascorbic acid foods. As it stands, it appears that the control diet must have differed in other respects than ascorbic acid from the scorbutogenic diets. This, in turn, elicits the admission that the deficiency of something else in the other groups could have factored in the observed bone loss. Parenthetically, this is also borne out in the tremendous weight gain of the control animals. However, Father Chance would have had to work overtime to produce the close relationship observed between dosage and bone level in the other groups. In other words, vitamin C most assuredly displayed dominance among the operating factors.
How interesting it would be if guinea pig physiology exactly paralleled that of the human being. If this were true, one could, with a few corrections for difference in size and longevity, estimate what would have happened in human beings under these same conditions. Such a direct translation would, of course, outrage even folly. But, at the risk of being labelled as insincere, it would still be interesting to transform these data into human measurements as a way to envisage the magnitude of observed changes.
Size is easy to correct for. The alveolar height of guinea pigs (as recorded in this study) tends to be about one-fourth that of human beings (according to mandibular x-ray measurements). This would mean that actual distances from guinea pig jaws would have to be multiplied by four. But, it will be recalled, the guinea pig radiographs were magnified four times before measurements were taken. Thus, recorded guinea pig alveolar height should be equivalent to that of the human being.
Longevity comparisons involve more hazardous speculations. It has been very crudely estimated that twenty-six days (the length of the experimental period) of guinea pig life is equal to about thirty months of human life.*** It will be assumed, for purposes of simplicity, that human age, corresponding to the young adult guinea pig age, is about thirty years. This means that the experimental period will be equal to the period of human life from thirty to thirty-two and a half years.
It remains to estimate the magnitude of the group differences due to variations in ascorbic acid intake. Group E received 20 mgm. of ascorbic acid per kilogram per day. This was considered to be 100 percent. Groups D, C, and B received respectively 75, 50, and 25 percent of the dosage of the Group E animals. If one considers 75 mgm. per day to be the 100 percent level for human beings, and this is the recommended dosage, it is then simple enough to calculate the human equivalents of the guinea pig dosages. Human beings corresponding to Group A would be ingesting no ascorbic acid; Group B 19 mgm. per daily intake; for Groups C, D, and E, 38, 56, and 75 mgm. per day respectively.
Since Groups B, C, and D did not differ significantly, only three categories will be considered. If human beings were able to survive with no ascorbic acid for this specific period of time, and they presumably can, their alveolar bone height might be about 23.3 mm. (Table 6). Those receiving 100 percent or 75 mgm. ascorbic acid per day would, then, exhibit a level of 15.0 mm–an 8.3 mm. difference. Considering the level, 15.0 mm., to be normal, it is easy to see that the completely scorbutic person would have lost all of his teeth in this time interval. Taking Group C as representative of the second category, a human of this group would be ingesting an average of 38 mgm. ascorbic acid per day. This, incidentally, is not an infrequent dietary finding, if dental students are any measure of what people ingest.38 Even at this daily intake, human beings would show a 1.8 mm. bone loss in a 30 month period. This is an average of approximately .72 mm. per year which is a subtle loss of bone. Perhaps human bone loss could even be more insidious as the subclinical deficiency becomes less pronounced. But add to this mild ascorbic acid deficiency several more mild defects, both of a local and systemic nature, and it becomes amazing that alveolar bone is not lost faster.
Making guinea pigs into human beings is a humorous pastime. It is certainly foolhardy to be sincere in such a game. But, even if there were half truth in such comparison, the inferences would still be staggering.
Conclusions
- In the assay of ascorbic acid requirements of guinea pigs, one has the choice of various criteria.
- Estimated requirements vary widely with the specific criterion employed.
- Most research to determine ascorbic acid requirements has been with young animals on a scorbutic versus nonscorbutic diet.
- To stimulate human affairs more closely, young adult animals were placed on ascorbic acid deficient diets.
- Weight gain is a popular basis of health particularly in young, growing animals. Weight, as a criterion of ascorbic acid status in older animals, was studied and discarded.
- Alveolar bone level was evaluated as a criterion in older animals. It appears to offer some merit of ascorbic acid status. Alveolar bone level closely paralleled ascorbic acid dosage. On the basis of this index, the recommended allowance for young adult animals is 7.3 to 8.9 mgm. per day or 15-20 mgm./kilogram/day.
- The alveolar bone protective dosage exceeds all other popular recommended dosages. The next highest allowances are those based upon prolonged survival and reproduction.
- These observations have very definite implications for human ascorbic acid research.
This investigation was supported in part by a grant {A-2899} from the National Institute of Arthritis and Metabolic Diseases, National Institutes of Health.
*Animals of this size were in keeping with the philosophy of this experiment, namely, to try to simulate the experience in the adult human being. Animals of this larger size are of the adult type and the possibility of translating derived information to the human being is more real.
**The phrases, alveolar bone height, alveolar bone level and alveolar bone loss will be used interchangeably, all referring to the alveolar bone index as explained above.
***It has been extremely difficult to correlate human and guinea pig age. The best available evidence (Dr. James B. Rogers, Department of Anatomy, University of Louisville) suggests that the guinea pig lives 2.2 years. Thus, since man lives about 70 years, 26 days in a guinea pig’s life is very roughly equivalent to 30 months in the human being.
References Cited:
- Boyle, P. E., Bessey, O. A. and Wolbach, S. B. “Experimental alveolar bone atrophy produced by ascorbic acid deficiency and its relation to pyorrhea alveolaris.” Proc. Soc. Exper. Biol. and Med. 36: #733- 735, June 1937.
- Boyle, P. E. “Experimental scurvy in guinea pigs and its relation to diffuse alveolar atrophy in human subjects.” Harvard Dent. Record 11: #3, 5-9, April 1937.
- Boyle, P. E., Bessey, O. A. and Wolbach, S. B. “Experimental production of the diffuse alveolar bone atrophy of periodontal disease by diets deficient in ascorbic acid (vitamin C).” J. A. D. A. and Dent. Cosmos 24: #11, 1768-1777, November 1937.
- Waugh, W. A. and King, C. G. “Isolation and identification of vitamin C.” Jour. Biol. Chem. 97: #1, 325-331, July 1932.
- Waugh, W. A. and King, C. G. “The vitamin C activity of hexuronic acid from suprarenal glands.” Science 76: #1983, 630, December 1932.
- Svirbely, J. L. and Szent-Gyorgi, A. “The chemical nature of vitamin C.” Biochem. Jour. 27: 279-285, 1933.
- Randoin, L. “Sur le degré d’activité antiscorbutique de l’acide ascorbique.” Compt. rend. soc. biol. 116: 4-6, May 1934.
- Gothlin, G. “Human daily requirements of dietary ascorbic acid.” Nature 134: #3384, 569-570, October 1934.
- Djabri, A. “Effet de l’acide l-ascorbique sur l’ostéogenèse et la minéralisation des os du caboye.” Z. Vitaminforsch. 10:210-222, February 1940.
- Dunker, C. F., Fellers, C. R. and Esselin, W. B., Jr. “A comparison of four methods for determining vitamin C with a 25 day weight response bioassay.” Food Research 7: #4, 260-266, July-August 1942.
- Crampton, E. W., Collier, B. C., Woolsey, L. D. and Farmer, F. A. “A new procedure for the bioassay of vitamin C.” Science 100: #2609, 599-600, December 1944.
- Sherman, H. C., LaMer, V. K. and Campbell, H. L. “The quantitative determination of the antiscorbutic vitamin (vitamin C).” Jour. Amer. Clin. Soc. 44: #1, 165-172, January 1922.
- Dawborn, M. C. “The determination of vitamin C by the growth of guinea pigs.” Australian Jour. Exper. Biol. Med. Sc. 23: #4, 281-287, December 1945.
- Coward, K. H. and Kassner, E. W. “The determination of vitamin C by means of its influence on the body weights of guinea pigs.” Biochem. Jour. 30: 1719-1727, 1936.
- Cohen, M. B. “Relative ease of interference with growth and development in the guinea pig.” Amer. Jour. Dis. Child. 60: #3, 636-639, September 1940.
- Schwachman, H. and Gould, B. S. “Serum phosphatase in experimental scurvy.” Jour. Nutrition 23: #3, 271-281, March 1942.
- Harris, L. J. and Ray, S. N. “Standardization of the antiscorbutic potency of ascorbic acid.” Biochem. Jour. 27: 2016-2021, 1933.
- Key, K. M. and Morgan, B. G. E. “The determination of the vitamin C value of ascorbic acid.” Biochem. Jour. 27: 1030-1035, 1933.
- Kuether, C. A. Telford, I. R. and Roe, J. H. “The relation of the blood level of ascorbic acid to the tissue concentration of this vitamin and to the histology of the incisor teeth of the guinea pig.” Jour. Nutrition 28: #5, 347-358, November 1944.
- Hou, H. C. “Further studies on the chemical and biological assay of vitamin C.” Chinese Jour. Physiol. 10:.#1, 191-198, February 1936.
- Dann, M. and Cowgill, G. R. “The vitamin C requirement of the guinea pig.” Jour. Nutrition 9: #4, 507-519, April 1935.
- Pfander, W. H. and Mitchell, H. H. “The ascorbic acid requirement of the guinea pig when adrenal weight and odontoblastic height are used as criteria.” Jour. Nutrition 47: #4, 503-522, August 11, 1952.
- Hojer, A. “Method of determining the antiscorbutic value of foodstuff by means of histological examination of the teeth of young guinea pigs.” Brit. Jour. Exper. Path. 7: #6, 356-360, December 1926.
- Zilva, S. S. “Vitamin C requirements of the guinea pig.” Biochem. Jour. 30: #8, 1419-1429, 1936.
- Penny, J. R. and Zilva, S. S. “The fixation and retention of ascorbic acid by the guinea pig.” Biochem. Jour. 40: #5-6, 695-706, November-December 1946.
- Giroud, A., Chalopin, H., Ratsimamanga, R. and Mundry, M. “Les quantités de vitamine C présentes dans l’organisme pervent-elles, a titre secondaire, servir de réserves?” Bull. soc. chim. biol. 25: #4, 144- 146, April 1943.
- Giroud, A., Leblond, C. P. and Ratsimamanga, R. “The vitamin C requirement of the guinea pig.” Yale Jour. Biol. and Med. 9: #6, 573,584, July 1937.
- Giroud, A. Leblond, C. P., Ratsimamanga, R. and Gero, E. “Realization du taux normal chez le cabaze.” Bull. soc. chim. biol. 20: #9, 1088-1096, July 1938.
- Giroud, A., Leblond, C. P., Ratsimamanga, R. and Rabinowicz, M. “Réalisation du taux normal d’acide ascorbique chez l’organism carencable.” Compt. rend. soc. biol. 120: 633-635, November 1935.
- Bourne, G. H. “Vitamin C and repair of injured tissues.” Lancet 243: #6223, 661-664, December 1942.
- Bourne, G. H. “Effect of vitamin C deficiency on experimental wounds.” Lancet 246: #6300, 688-692, May 1944.
- Bourne, G. H. “The effect of vitamin C on the healing of wounds.” Proc. Nutrition Soc. 4: #3-4, 204- 210, 1946.
- Bourne, G. H. “The effect of graded doses of vitamin C upon the regeneration of bone in guinea pigs on a scorbutic diet.” Jour. Physiol. 101:#3, 327-336, November 1942.
- Bourne, G. H. “The relative importance of periosteum and endosteum in bone healing and the relationship of vitamin C to their activities.” Proc. Roy. Soc. Med. 37: #6, 275-279, April 1944.
- Hines, H. M., Lazere, B., Thomson, J. D. and Cretzmeyer, C. H. “A study of neuromuscular regeneration under different levels of vitamin C.” Jour. Nutrition 27: #4, 303-308, April 1944.
- Gould, B. S. and Schwachman, H. “A new method for the bioassay of antiscorbutic substances.” Jour. Biol. Chem. 151: #2, 439-453, December 1943.
- Crampton E. W. and Bell, J. M. “Studies on the dietary requirements of guinea pigs.” Sci. Agr. 27: #2, 57-66, February 1947.
- Cheraskin, E., Dunbar, J. B. and Flynn, F. H. “The intradermal ascorbic acid test, Part III. A study of forty-two dental students.” Jour. Dent. Med. 13: #3, 135-155, July 1958.
- Cheraskin. E. “The arithmetic of disease.” Jour. Dent. Med. 14: #2, 71-82, April 1959.