
Access to all articles, new health classes, discounts in our store, and more!
Influence of Nutrients on Behavior
Typed, undated manuscript, publication information unspecified.
* * *
Introduction
Whatever behavioral process takes place, whether feeling or overt action, it is our belief that there necessarily must be concomitant or correlative biochemical reactions….We cannot conceive of even a thought occurring without its counterpart of biochemical and physiological events….The myriad of biochemical reactions required to utilize carbohydrate as a fuel and convert it to needed chemical energy is essentially common to all metabolizing cells and organs whether they are found in plants, bacteria, or any other living organism. It should, therefore, be clear that general biochemical principles which are applicable to the liver and lungs are found equally applicable to the brain (Eiduson, 1964).
This citation serves as a prelude to this report on the influence of nutrients on behavior. In brief, an attempt will be made in this study to answer the following seven questions:
- What are the characteristics of patients with behavioral disorders?
- Is it possible to demonstrate an organically sound mental patient?
- Are behavioral problems of genetic or environmental origin?
- Are there relationships between nutrients and behavior?
- Are there relationships between nondietary variables and behavior?
- Is there a cause-and-effect relationship between dietary and nondietary factors and behavioral problems?
- Can these data suggest evidence for an optimal dosage of nutrients?
Method of Investigation
Approximately 700 dentists and their wives have been participating in a multiple testing project for almost ten years. More precisely, one segment of this population is sponsored by the Southern Academy of Clinical Nutrition, another is under the aegis of the Southern California Academy of Nutritional Research, a third group is under the direction of the Ohio Academy of Clinical Nutrition, the fourth is part of the Northeast Academy of Clinical Nutrition, and the fifth operates under the auspices of the Northern California Academy of Nutritional Research.
The common denominator in all of these groups is that these are members of the health professions interested in studying their own health patterns. As far as can be determined, no one in the group can be regarded as suffering with a classical psychiatric disorder requiring traditional psychotherapy.
On an annual basis, the group is studied clinically, electrocardiographically, biochemically, and nutritionally. Each subject annually completes the Cornell Medical Index Health Questionnaire (Brodman, et al.,1949) and the Cornell Word Form-2 (Weider, et al.,1955) which are employed for psychometric purposes. At each of these same visits each subject also completes two dietary forms, the seven-day Dicalator System (Dicalator) and the food frequency Dietronics Dietary Analysis (Abramson, et al., 1963).
The Cornell Medical Index Health Questionnaire (CMI) is a list of 195 questions followed by two responses, yes and no. The subject is asked to choose the appropriate response. If in doubt, the subject is asked to guess. The CMI has been devised as an instrument for quickly obtaining a descriptive sketch, for clinical interpretation, of a person’s attitudes, moods and feelings, emotions and bodily reactions.
Each subject also completed the Cornell Word Form-2 (CWF-2). The questionnaire is a modification of the ordinary type of individually administered word association technique in that it is a “forced choice” method. The subject is presented with a list of stimulus words, each followed by two other responses. The subject is asked to choose the one he or she thinks relates better with the stimulus word. The CWF-2 has been developed to provide a descriptive clinical sketch of the individual’s emotional status from responses relating to attitudes, feelings, moods and bodily reactions. It has been devised to do so in a manner not readily discernible to the subject in order to increase the degree of objectivity. A word form score of 8 or more screens between 40 to 50 percent of those persons with serious neuropsychiatric and psychosomatic disturbances and a few ostensibly healthy persons. A score of 5 or more screens between 70 and 80 percent of those with serious neuropsychiatric and psychosomatic disturbances and a moderate number of ostensibly healthy persons.
At each visit, each subject completed two dietary records. One consists of recording all food consumed for a seven-day period (Dicalator System). The chart is then submitted to a computer center and a printout becomes available outlining the daily intake of all of the major foodstuffs as well as the most common vitamins and minerals. A second form, called the Dietronics Dietary Analysis, is a simple questionnaire designed to determine the dietary habits based upon food frequency. This dietary form is also submitted to a computer center and a printout is derived spelling out the daily intake of the major foodstuffs and the vitamins and minerals.
Results
Question One: One of the characteristics of a disease process is the progressive increase in symptoms and signs with advancing age. Initially, and this is most prevalent in the younger years, the clinical findings are seemingly unrelated (Figure One). For example, there may be a symptom or sign in one organ system and in another site. This is the circle on the extreme left. With time, the findings become more numerous and more concentrated in one organ or system. This is the center circle. Finally, the symptoms and signs gel, according to textbook descriptions, so that a diagnosis of a specific syndrome (i.e., arthritis, cancer, heart disease, schizophrenia) is possible. This is pictured on the extreme right. Clearly, the identification of disease progressively decreases as one moves from the circle on the right to the left. On the other hand, the anticipation of disease increases as one progresses from the right to the left.
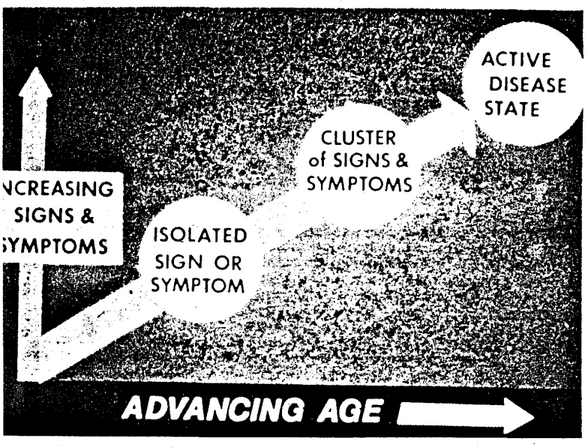
Figure One. The genesis of disease. With advancing age, pictured on the abscissa, there is usually a progressive increase in symptoms and signs, described on the ordinate. At first, there is an isolated symptom and/or sign identified in the area on the extreme left. With time, the symptoms and signs multiply in number and severity and begin to localize in sites or systems as shown in the central area. Finally, the clinical picture is clearcut enough (pictured on the right) to justify a typical textbook designation such as schizophrenia or manic-depressive psychosis.
Accordingly, it is possible to view patients with behavioral problems by utilizing the three categories shown (Figure One). One may wish to simply describe patients in terms of traditional syndromes. This is shown by the circle on the extreme right. On the other hand, it is possible to categorize subjects in terms of the very earliest behavioral problems. This is exemplified by the circle on the extreme left.
Hence, in answer to question one, one can view behavioral problems at a number of different levels ranging from the very early nonspecific to the very precise late stages.
Question Two: By act, if not by word, it is generally assumed that, if the patient is organically sound and still has clinical problems, then the syndrome must be of a purely mental nature. Hence, it is in order to examine the physical state of people with emotional problems viewed in terms of the area at the extreme left ( Figure One).
For example, the ratio of height to weight is known as the ponderal index (PI). In actual practice, the ponderal index is derived from the height (expressed in inches) divided by the cube root of the weight (in pounds). For practical purposes, the lower the ponderal index, the heavier is the subject for his height. Conversely, the higher the ponderal index, the lighter is the individual for his height. Figure Two shows the subjects with the best psychic picture (CWF-2 = 0) are statistically significantly lighter than those with psychologic complaints. Or, put another way, the heavier the individual, the greater the possibility for psychologic findings. Additionally, it is evident from Figure Two that not only is the mean ponderal index higher in those with no complaints versus those with one or more psychologic complaints, but also the variance is greater in the group with psychologic findings. Hence, actually, individuals with psychologic complaints tend to be on the light or the heavy side.
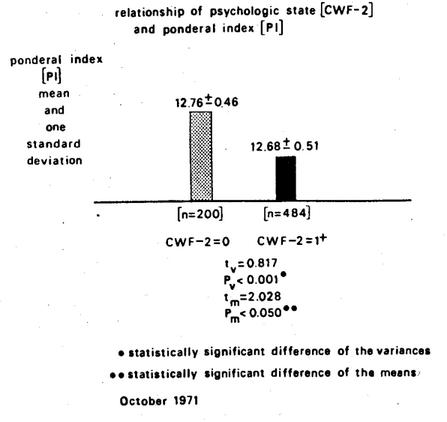
Figure Two. The relationship of psychic state (as judged by the CWF-2 scores) versus weight (as measured by the ponderal index). Those subjects with the greater number of psychologic symptoms and signs are the subjects who tend to be heavier, in fact, heavier or lighter.
Thus, in partial answer to question two, it appears that individuals who are emotionally sound are more apt to show a weight pattern within a very narrow range. Conversely, those with emotional problems tend to be either on the under- or overweight side.
If one studies the subjects with and without psychic symptoms and signs in terms of organ systems, it is noteworthy that the mental illness prone individual is more beset with general symptoms and signs. Figure Three shows that those individuals with no psychic symptoms and signs tend to have significantly fewer gastrointestinal findings. Specifically, the mean reported gastrointestinal symptoms and signs are 1.5 in the psychologically sound group and 2.2 in those with one or more psychologic complaints.
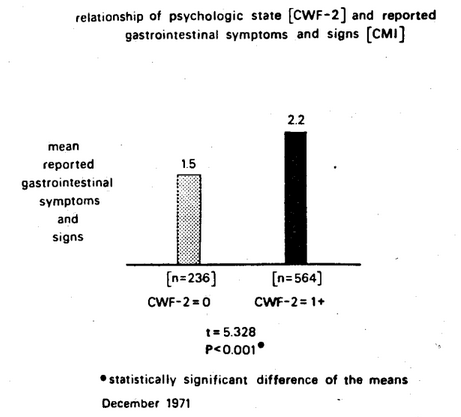
Figure Three. The relationship of psychic scores and gastrointestinal findings. It is clear that the group characterized by no psychic findings (CWF-2 = 0) reveals the lesser number of gastrointestinal symptoms and signs .
Many other clinical and physiologic parameters appear to be significantly different in individuals with and without psychologic findings. For example, Figure Four shows that the height of the T-wave in Lead I of the electrocardiogram is significantly higher in the subjects with the healthier psychic pattern (CWF-2 = 0).
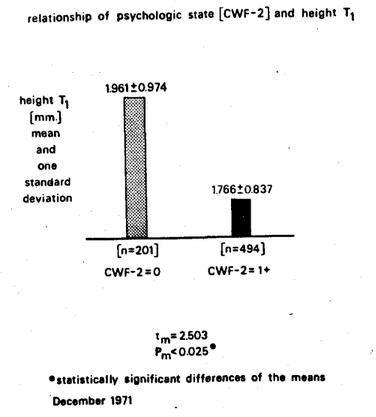
Figure Four. The relationship of psychic state (as measured by :he CWF-2 score) versus cardiac status (as determined by the height of T in Lead I in the electrocardiogram). The subjects with the better psychic state (CWF-2 = 0) show the higher T wave and the greater variance.
Attempts have also been made to identify biochemical correlates in terms of the mental illness proneness profile. For example, Figure Five outlines the classical oral three-hour glucose tolerance patterns for subjects with and without psychic complaints as judged by the Cornell Word Form-2 test. The evidence indicates that there are statistically significant differences in variance at the two- and three-hour temporal points. Translated into nonstatistical language, this means that at two and three hours there were more subjects with hyper- or hypo-glycemia in the group with psychologic findings than in the group without psychologic symptoms and signs.
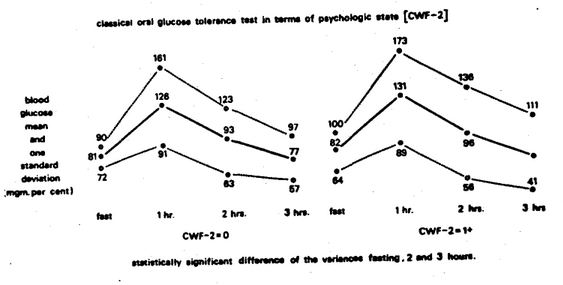
Figure Five. The classical glucose tolerance test patterns in subjects with and without psychologic complaints as determined from the Cornell Word Form-2 test. The evidence suggests that there is more evidence of hyper- and hypoglycemia at the two-and three-hour temporal points in the group with the CWF-2 = 1+ than in the group with no psychologic findings (CWF-2 = 0).
Accordingly, in answer to question two, the evidence suggests that it is impossible to demonstrate an organically well individual beset with only emotional problems.
Question Three: It is generally assumed that problems which appear in families are genetically inspired (Cheraskin & Ringsdorf, 1971a; 1973). The fact that environment plays a significant familial role is underscored through a study of a number of characteristics determined in the husband-wife relationship where genetics usually plays no role.
To investigate the influence of environment upon the psychic state, 150 adult subjects were studied in three groups. One-third consisted of married women; one-third consisted of their husbands; and one-third consisted of unrelated females (randomly drawn) age-paired to the wives. Psychic state was determined by Cornell Word Form-2. In the two male-female comparisons, the psychic responses were significantly related only in the husband-wife group (Figure Six) and in this group the correlation increased with advancing age (from 0.124 to 0.502). Since the husbands and their wives presumably live under similar conditions, those who have been married fifteen years or longer have slept the 4,000 nights or more in the same room, eaten perhaps 15,000 meals together (Cheraskin, et al., 1974a), this may constitute evidence for the role of environment in psychic state, without any way minimizing other causative factors.
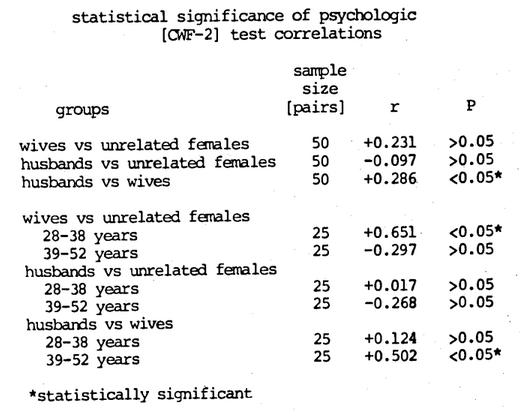
Figure Six. It is clear from a study of husband-wife psychologic symptoms and signs that (1) there is a statistically significant positive correlation in the family unit, and (2) the husbands and wives are not necessarily similar when they marry but do become similar with length of marriage.
It is noteworthy that familial parallelisms (husband-wife) exist at all levels studied, including clinical state (Cheraskin & Ringsdorf, 1969a; 1970a), biochemistry (Cheraskin, et al., 1968; Cheraskin & Ringsdorf, 1970b; 1970c), enzymes (Cheraskin & Ringsdorf, 1970d; 1970e; Cheraskin, Ringsdorf & Medford, 1975a; 1975b; 1976a; 1976b), and even diet (Cheraskin & Ringsdorf, 1969b; 1970f; 1970g; 1971b; 1970h).
Accordingly, in answer to the third question, there is ample evidence that the environment plays a significant role in health and disease. Therefore, it is not inappropriate to look to life style (diet, physical activity, tobacco, alcohol, coffee/tea, etc.) for the causation of many psychologic problems.
Question Four: Without question, major effort is presently being directed toward the relationship of vitamin B3 (niacin) to schizophrenia. This is a logical outcome of the history of pellagra and its relationship to vitamin B3 and its precursor, tryptophan. However, only scant attention has been accorded to the relationship of daily niacin consumption to marginal psychologic findings.
Figure Seven is designed to study the relationship of psychologic state (as measured by the Cornell Word Form-2 score) versus daily vitamin B3 (niacin) consumption in milligrams (as judged by the seven-day dietary survey). Two points warrant special mention. First, the mean daily vitamin B3 intake in the group with the better psychic state (as determined by CWF-2 score of 0) is 20 mgms.; in contrast, the vitamin B3 daily consumption in the CWF-2 group with one or more pathologic responses is 18 mgms. This is a 14 percent lower niacin intake in the group with the poor psychologic score. Second, the difference between the two groups is statistically highly significant (t=3.774, P<0.001).
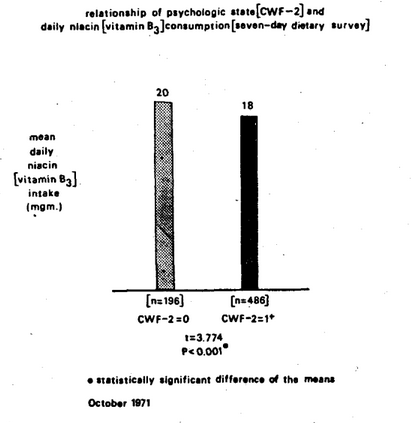
Figure Seven. The relationship of psychologic state as judged by the CWF-2 score and daily niacin (vitamin B3) consumption as measured by the seven-day dietary record. Clearly, the higher niacin intake is observed in the psychologically sounder group.
Figure Eight is a summary of the relationship of the CWF-2 scores in terms of all nutrients studied by the seven-day dietary survey technique. Additionally, the point should be made that the nutrients have been arranged in decreasing order of statistical importance as determined by the t value.
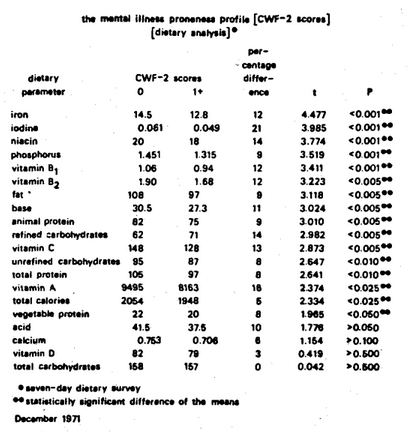
Figure Eight. The mental illness proneness profile as described from the CWF-2 test and the seven-day dietary survey. The subjects with the better psychologic score show higher intake of practically all nutrients. The one exception is the lower intake of refined carbohydrate foodstuffs.
Four points deserve particular mention. First, it is clear that niacin fits into the scheme of the mental illness proneness profile. However, arrayed in statistical order, it ranks third among the sixteen significant nutrient analyses. Second, it will be observed that iron appears to be the most statistically dominant variable in this particular experiment (t=4.477, P<0.001). This point is noteworthy since iron is usually not considered to play a role in mental illness. Third, Figure Eight shows that, quite consistently, the group with no psychologic illness (CWF-2 = 0) is characterized by higher mean nutrient intakes except for refined carbohydrate food intake. Finally, the majority of.the nutrients studied showed statistically significant relationships. Actually, 16 out of 20 nutritional evaluations were significantly related to the emotional state.
It is fair to conclude, in answer to the fourth question, from these and other observations that there are indeed statistically significant relationships between most of the nutrients and behavioral patterns.
Question Five: Mention was made earlier that there is good reason to investigate life style for contributing factors to emotional problems. Diet has already been examined. Brief mention should be made of others if for no other reason than to dispel the notion that diet is the sole causative agent.
Figure Nine shows the relationship between the psychologic state as judged by the Cornell Word Form-2 and the amount of daily exercise as evaluated by the answers to the Cornell Medical Index Health Questionnaire. The nonexercisers had a significantly higher mean psychologic score (2.5) than the exercisers (1.6).
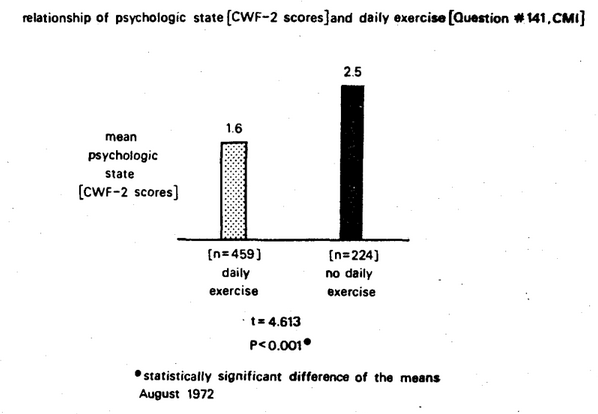
Figure Nine. Relationship of the psychologic state as judged by the Cornell Word Form-2 scores and the daily exercise as determined by the answers to question 141 of the Cornell Medical Index Health Questionnaire. The no exercise group (black column) had more psychologic symptoms and signs than did the exercise group (stippled column). The difference was statistically significant (t = 4.613, P<0 .00).
Within the limits of this study, it would seem that exercise and diet exerted independent causative actions. Figure Ten represents an attempt to assess their relative roles by the means of the psychologic score versus both the daily intake of refined carbohydrates and the daily amount of exercise. The best psychologic state, as judged by the lowest score of 1.5, was achieved by those who exercised in association with the low intake of refined carbohydrates. This group was significantly different from the other three groups. Conversely, the group characterized by no exercise and a relatively high intake of refined carbohydrate had the poorest psychologic state as judged by the highest psychologic score (2.6). Within the limits of these studies and in answer to the fifth question, it is abundantly clear that many life style variables parallel emotional upheaval. When both nondietary and dietary factors are viewed in combination, the relationship of psychologic state and the life style sharpens.
Question Six: For purely predictive and diagnostic purposes, simple correlation suffices. In other words, if variable A correlates with regularity with variable B, then one can predict A from B or B from A whether the causal relationship is direct, indirect, or does not exist. However, it is helpful and more significant if there are cause-and-effect relationships in addition to correlative relationships.
Earlier mention was made that the data for this report were derived from multiple testing programs conducted to determine the health of members of the health professions. It is, therefore, interesting to observe the changes in psychologic state in terms of changes in some of the variables described earlier.
Figure Eleven shows the initial and final psychologic scores in two groups. One group decreased refined carbohydrate intake for an experimental one-year period. The other group did not decrease refined carbohydrate consumption during the same experimental interval. In the subjects who decreased their intake of refined carbohydrates, there was a statistically significant 45 percent reduction in the psychologic score. However, there was no significant reduction in the psychologic value in the group which did not decrease its intake of refined carbohydrates.
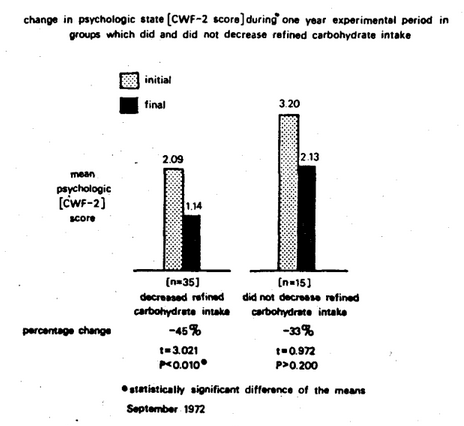
Figure Eleven. Change in psychologic state as reflected in the CWF-2 scores during a one-year experimental period, in subjects who decreased their intake of refined carbohydrates versus subjects who did not decrease their intake. The 45 percent reduction in the mean CWF-2 score for those who decreased their intake of refined carbohydrates was significant at the 1 percent confidence level. The 33 percent reduction in the mean CWF-2 score for those who did not decrease their intake was not statistically significant.
As additional evidence of cause-and-effect, Figure Twelve outlines the changes in tryptophane intake versus psychologic score during a one-year period. In the subjects who increased their tryptophane consumption (group I on the left), there was a statistically significant reduction in the CWF-2 score by 50 percent (group I on the right). In the individuals who did not increase tryptophane intake (group II on the left), there was no significant change in psychologic scores (group II on the right). This study has since been repeated with a larger sample and with the same results (Figure Thirteen). This is consistent with the recent findings that l-tryptophane supplementation in insomniacs and depressed patients frequently enhances sleep (Wyatt, et al., 1970).
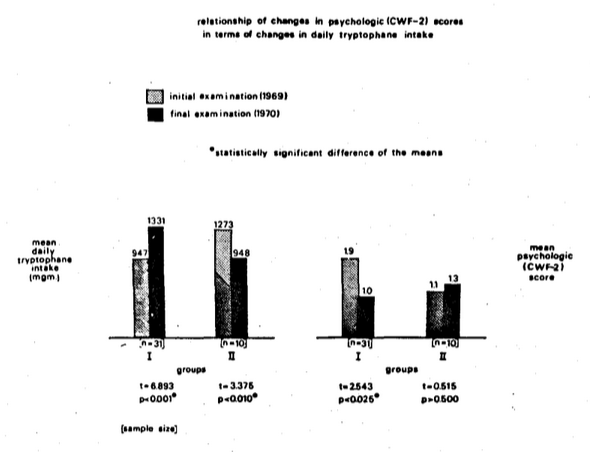
Figure Twelve. The effect of change in tryptophane consumption upon psychologic state. In the group characterized by an increase (group I on the left), there is a decrease in psychologic score (group I on the right). In the group with no increase in tryptophane (group II on the left), there is no significant decrease in psychologic score (group II on the right).
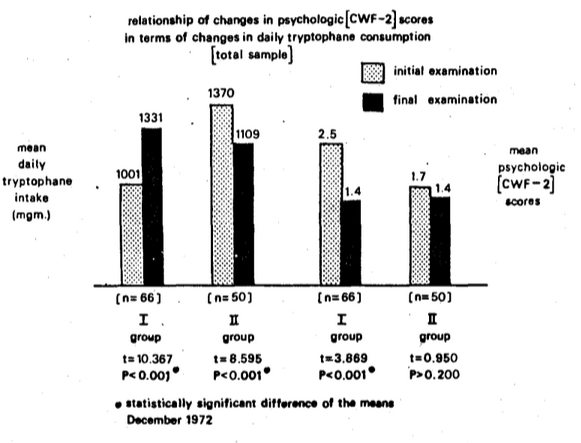
Figure Thirteen. The effect of changes in tryptophane consumption upon psychologic state in a larger sample. The pattern is similar to that pictured in Figure Twelve.
Thus, with these simple examples supported by others, the evidence is reasonably clear, in answer to Question Six, that there are cause-and-effect relationships between dietary factors and behavioral problems.
Question Seven: There is no doubt but that the relationship of nutrients to behavior is in good measure a function of dosage. The Recommended Dietary Allowances have been spelled out by the Food and Nutrition Board of the National Academy of Sciences-National Research Council in Washington, D.C. (Food and Nutrition Board, 1974).
For example, according to the Food and Nutrition Board, 45 mgm.vitamin C daily is adequate to maintain optimal health in the reference human. Professor Linus Pauling contends that the daily intake should range from a low of 250 mgm. (which is five- to sixfold the traditional recommendation) to 10,000 mgm. (which is 222 times the current recommendation). The burning question is how to develop an experimental model to resolve this dilemma.
Figure Fourteen is an attempt to resolve the question through a study of the daily vitamin C consumption in a progressively healthier sample. Ten hundred eighty-six observations were made on a group of presumably healthy doctors and their wives (Cheraskin, 1974b; Cheraskin & Ringsdorf, 1974c). The mean number of clinical symptoms and signs was 16.2. The daily vitamin C consumption was found to be 140+81 mgm. As one progressively eliminates people with problems, the group becomes progressively healthier by virtue of the fact that they manifest fewer symptoms and signs. For example, 1061 of the 1086 reported <50 clinical findings. In other words, the 25 with >50 clinical findings have been excluded. The daily vitamin C consumption is 141+81 in the group with a mean of 14.1 clinical findings. As one proceeds in the development of a progressively healthier individual, the mean daily ascorbic acid intake progressively increases. Hence, within the limits of this experiment, those subjects with no clinical findings consume about 167 mgm. vitamin C daily, which is about four times the present recommendation of 45 mgm. Utilizing a different dietary technique (Cheraskin, Ringsdorf & Medford; Submitted for Publication) (The food frequency questionnaire versus the seven-day dietary survey), the ideal vitamin C intake appears to be about 410 mgm. per day (Figure Fifteen).
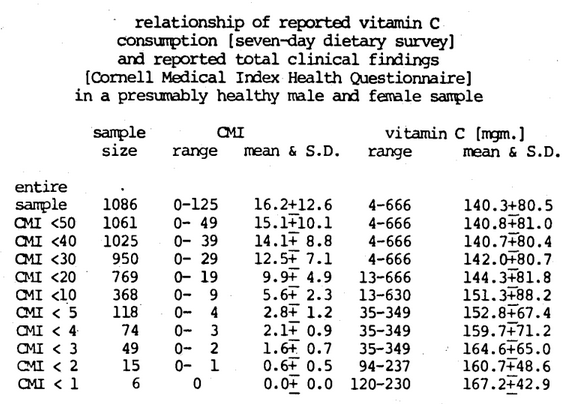
Figure Fourteen. In a progressively healthier sample of subjects as judged by progressively fewer symptoms and signs, the mean daily vitamin C consumption is progressively higher and reaches an ideal level of approximately 167 mgm. per day.
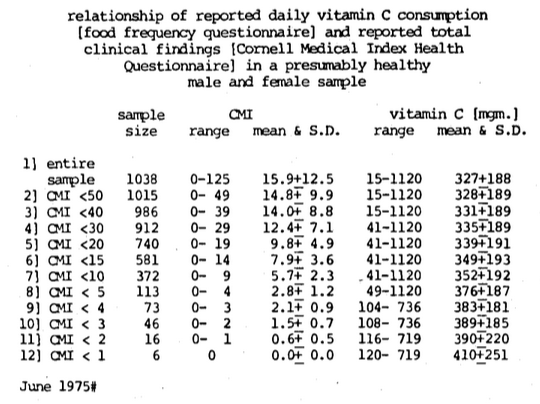
Figure Fifteen. Utilizing a different method for determining diet (food frequency questionnaire), the ideal daily vitamin C intake approaches approximately 410 mgm.
The approach outlined here for vitamin C has also been applied to the daily refined carbohydrate consumption in a progressively healthier human population. Figure Sixteen shows that the daily refined carbohydrate intake ranges from 0 to 223 grams in a sample of reputedly healthy doctors and their wives (Cheraskin & Ringsdorf, 1974d). The mean and one standard deviation for daily refined carbohydrate intake is 66.0+36.1. If one now deletes all subjects with 50 or more symptoms and signs, then one is left with a sample size of 1062 with a range from 0 to 49 clinical symptoms and signs and a mean of 15.1+10.2 and showing a daily refined carbohydrate intake ranging from 0 to 223 grams per day and a mean and standard deviation of 66.0+36.1. As one reduces the number of allowable clinical symptoms and signs, the sample size obviously decreases, as does the range of clinical symptoms and signs and the means and standard deviation. It will be noted also that the daily refined carbohydrate intake range shrinks and its mean and standard deviation also decreases sharply.
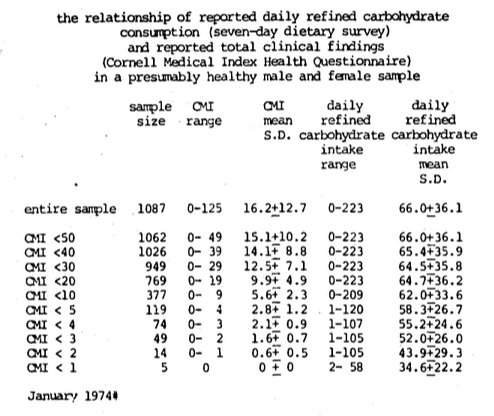
Figure Sixteen. The relationship of reported daily refined carbohydrate consumption (seven-day dietary survey) and reported total clinical findings (Cornell Medical Index Health Questionnaire) in a presumably healthy male and female sample. As the group becomes progressively healthier by virtue of progressively fewer symptoms and signs, the daily refined carbohydrate consumption decreases markedly.
Utilizing this very same experimental model, the ideal daily vitamin A intake (Cheraskin, Ringsdorf & Medford, 1976c) (Figure Seventeen), niacin (Cheraskin, Ringsdorf & Medford, 1976d) (Figure Eighteen), and tryptophane (Cheraskin, Ringsdorf & Medford; In Preparation) (Figure Nineteen) has been established.
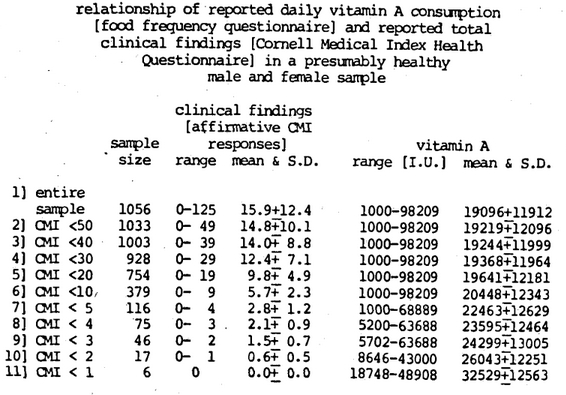
Figure Seventeen. The Recommended Dietary Allowance for vitamin A is presently 5000 I.U. As one develops a progressively healthier human population, the ideal vitamin A daily consumption approaches approximately 32,000 I.U., which is about sixfold the recommended allowance.
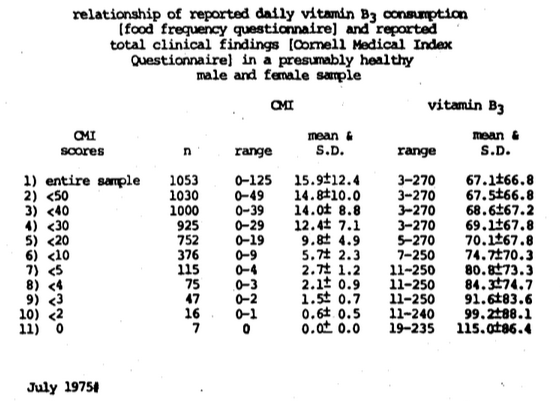
Figure Eighteen. The Recommended Dietary Allowance for niacin is approximately 12 to 20 mgm. per day (depending upon age and sex). As one develops a progressively healthier human population, the ideal daily niacin consumption approaches about 115 mgm. which is five- to sixfold greater.
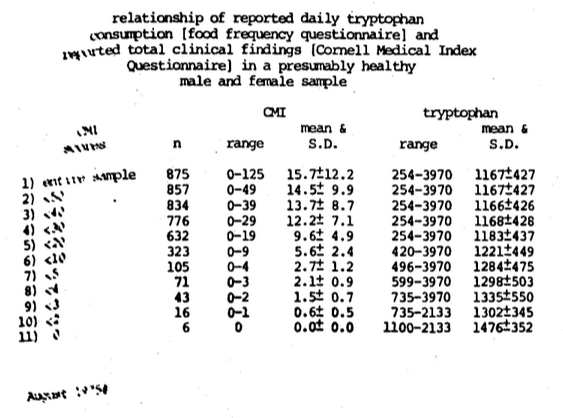
Figure Nineteen. The Recommended Dietary Allowance for tryptophane is 800 mgm. per day. As one develops a progressively healthier human population, the ideal tryptophane approaches 1500 mgm. which is threefold the presently recommended dosage.
On the basis of the information so derived, and in answer to the seventh and last question, the ideal nutrient intake seems to be several times greater than the amount suggested by the Food and Nutrition Board of the National Research Council-National Academy of Sciences.
Discussion
The terms resistance and susceptibility may be viewed in two different connotations (Schneider, 1951). From a descriptive standpoint, the labels are simple antonyms. Hence, there is little to be gained by viewing an individual’s succumbing to disease because of lowered resistance or increased susceptibility.
The designations resistance and susceptibility may be viewed in an analytic frame. In this sense, the tags have distinctly different meanings and practical implications. By definition, a resistance agent is one which, when added, tends to discourage disease and, when eliminated, tends to invite disease. A classical example would be vitamin C. Its addition tends to discourage the appearance of scurvy; its elimination invites scurvy. In contrast, a susceptibility agent is one which, when administered, invites disease and, when eliminated, discourages illness. An excellent example is sugar. Sugar in contact with the teeth tends to invite dental caries; its elimination discourages the development of dental decay.
Summary
The evidence presented in this report along with additional information provided in other works including our papers and books all indicate that there are a number of dietary and nondietary susceptibility factors operating in the behavioral state.
References Cited:
- Abramson, J. H., Slome, C. and Kosovsky, J. N., “Food frequency interview as an epidemiological tool,” Amer. J. Pub. Health, 53:1093-1101, 1963.
- Brodman, K., Erdmann, A. J., Jr. and Wolff, H. G., Cornell Medical Index Health Questionnaire Manual, New York, Cornell University Medical College, 1949.
- Cheraskin, E., Ringsdorf, W. M., Jr., Setyaadmadja, A. T. S. H., Barrett, R. A., Sibley, G. T. and Reid, R. W., “Environmental factors in blood glucose regulation,” J. Amer. Geriat. Soc., 16:823-825, 1968.
- Cheraskin, E. and Ringsdorf, W. M., Jr., “Familial factors in psychic adjustment,” J. Amer. Geriat. Soc., 17:609-611, 1969a.
- Cheraskin, E. and Ringsdorf, W. M., Jr., “Familial dietary patterns: I, Daily caloric consumption,” J. Appl. Nutr., 21:70-73, 1969b.
- Cheraskin, E. and Ringsdorf, W. M., Jr., “Familial clinical patterns: I, Reported symptoms and signs in the dentist and his wife,” Geriatrics, 25:123-126, 1970a.
- Cheraskin, E. and Ringsdorf, W. M., Jr., “Familial biochemical patterns: I, Serum cholesterol in the dentist and his wife,” J. Atheroscl. Res., 11:247-250, 1970b.
- Cheraskin, E. and Ringsdorf, W. M., Jr., “Familial biochemical patterns: II, Serum albumin levels in the dentist and his wife,” Nutr. Rep. Int., 1:313-318, 1970c.
- Cheraskin, E. and Ringsdorf, W. M., Jr., “Familial enzymic patterns: I, Serum glutamic oxalacetic transaminase (SGOT) in the dentist and his wife,” Nutr. Rep. Int., 1:119-124, 1970d.
- Cheraskin, E. and Ringsdorf, W. M., Jr., “Familial enzymic patterns: II, Lactic dehydrogenase (LDH) in the dentist and his wife,” Nutr. Rep. Int., 1:125-130, 1970e.
- Cheraskin, E. and Ringsdorf, W. M., Jr., “Familial dietary patterns: II, Daily carbohydrate consumption,” J. Appl. Nutr., 22:17-22, 1970f.
- Cheraskin, E. and Ringsdorf, W. M., Jr., “Familial dietary patterns: III, Daily fat consumption,” J. Appl. Nutr., 22:68-72, 1970g.
- Cheraskin, E. and Ringsdorf, W. M., Jr., “Familial dietary patterns: Daily vitamin A consumption in the dentist and his wife,” Int. J. Vit. Res., 40:125-130, 1970h.
- Cheraskin, E. and Ringsdorf, W. M., Jr., “Predictive medicine: III, Familial versus genetic factors,” J. Amer. Geriat. Soc., 9:887-893, 1971a.
- Cheraskin, E. and Ringsdorf, W. M., Jr., “Familial dietary pat:erns: IV, Daily protein consumption,” J. Appl. Nutr., 23:27-33, 1971b.
- Cheraskin, E. and Ringsdorf, W. M., Jr., Predictive Medicine: A Study in Strategy, Mountain View, California, Pacific Press Publishing Association, 81-90, 1973.
- Cheraskin, E., Ringsdorf, W.M., Jr. and Brecher, A., Psychodietetics, New York, Stein and Day Publishers, 147, 1974a.
- Cheraskin, E., “The name of the game is the name,” Proc. San Diego Biomed. Sympos., 1974, 13:31-39, 1974b.
- Cheraskin, E. and Ringsdorf, W. M., Jr., “Human vitamin C requirement: relation of daily intake to incidence of clinical symptoms and signs,” J. Int. Res. Comm., (IRCS), 2:1379, 1974c.
- Cheraskin, E. and Ringsdorf, W. M., Jr., “How much refined carbohydrate should we eat?” Amer. Lab., 6:31-35, 1974d.
- Cheraskin, E., Ringsdorf, W. M., Jr. and Medford, F. H., “Familial enzymic patterns: III, Serum glutamic oxaloacetic transaminase (SGOT) in the dentist and his wife (final report),” Nutr. Rep. Int., 12:35-40, 1975a.
- Cheraskin, E., Ringsdorf, W. M., Jr. and Medford, F. H., “Familial enzymic patterns: IV, Lactic dehydrogenase (LDH) in the dentist and his wife (final report),” Nutr. Rep. Int., 12:239-243, 1975b.
- Cheraskin, E., Ringsdorf, W. M., Jr. and Medford, F. H., “Familial enzymic patterns: V, Creatine phosphokinase (CPK) in the dentist and his wife (final report),” Nutr. Rep. Int., 13:175-180, 1976a.
- Cheraskin, E., Ringsdorf, W. M., Jr. and Medford, F. H., “Familial enzymic patterns: VI, Serum glutamic pyruvic transaminase (SGPT) in the dentist and his wife (final report),” Nutr. Rep. Int., 13:181-186, 1976b.
- Cheraskin, E., Ringsdorf, W. M., Jr. and Medford, F. H., “The ‘ideal’ daily vitamin A intake,” Int. J. Vit. Nut. Res., 46:11-13, 1976c.
- Cheraskin, E., Ringsdorf, W. M., Jr. and Medford, F. H., “The ‘ideal’ daily niacin intake,” Int. J. Vit. Nut. Res., 46:58-60, 1976d.
- Cheraskin, E., Ringsdorf, W. M., Jr. and Medford, F. H., “The ‘ideal’ daily vitamin C intake.” (Submitted for Publication)
- Cheraskin, E., Ringsdorf, W. M., Jr. and Medford, F. H., “The ‘ideal’ daily tryptophane consumption.” (In Preparation)
- Dicalator System, P.O. Box 3217, Olympic Station, Beverly Hills, California 90212.
- Eiduson, S., Geller, E., Yuwiler, A. and Eiduson, B. T., Biochemistry and Behavior, Princeton, New Jersey, D. Van.Nostrand Company, 4-5, 1964.
- Food and Nutrition Board, United States National Research Council-National Academy of Sciences, Recommended Dietary Allowances, Washington, D.C., National Academy of Sciences, 1974.
- Schneider, H. A., “Nutrition and resistance-susceptibility to infection,” Amer. J. Trop. Med., 31:174-182, 1951.
- Weider, A. B., Mittelman, D., Wechsler, D. and Wolff, H. G., “Further developments of the Cornell Word Form,” Psychiat. Quart., 29:588-594, 1955.
- Wyatt, R. J., Engleman, K., Kupfer, D. J., Fram, D. H., Sjoerdsma, A. and Snyder, F., “Effects of l-tryptophane (a natural sedative) on human sleep,” Lancet, 2:842-846, 1970.