
Access to all articles, new health classes, discounts in our store, and more!
Human Health and Homeostasis: VII Health and Homeostasis VII The Flip Side Health Practices
Published in International Journal Biosocial Medical Research, Vol. 13, No. 2, pp. 211-223, 1991.
* * *
Abstract
While the toximolecular approach is often the first line of treatment, the orthomolecular philosophy is more desired. Efforts are reported which identify dominant health practices as described by the Human Population Laboratory in CaIifornia. The importance of such health predictors to the homeostatic process is discussed. (Int. J. Biosocial Med. Res., 1991; 13(2): 211- 223.)
Introduction
In 1989, we wrote a book entitled Health and Happiness.1 The gist of the story is that no one has ever shown that the poorer the food, the more polluted the air, and the more foul the water, the healthier we are! While the converse has not yet been written, there’s enough proof that good food, and good air, and good water, often lead to good sleep and good thoughts and to homeostasis.
What constitutes “good” needs still to be resolved but there is considerable data in buzzwords called “health practices.”
Specific Health Practices
There are many investigators and laboratories that have tried to sort out lifestyle. They have arrived at more specific recommendations. The Human Population Laboratory2 (previously cited in Parts 1 and 5 of this series) has concluded that, of the many different characteristics of lifestyle, seven provide a reasonably accurate and predictable profile. They are smoking, weight in relation to desirable standards for height, drinking (alcohol), hours of sleep, regularity of meals, eating breakfast and physical activity. Incidentally, in a later report,3 the HPL has confirmed that only five health practices (excluding regularity of meals and eating breakfast) provide adequate prediction. That this combination is quite predictive is demonstrated in Table 1. According to the California Abridged Life Tables (1959-1961), the average 45-year-old male will live 27.56 more years (line 1). In other words, the life expectancy of the on-the-street California male 45 years old is 72.56 years. If this individual engages in only 0-3 of the just-mentioned health practices, he can be expected to live 21.63 years. Thus, this person can anticipate living to 66.63 or 5.93 years less than the average. If one participates in 4-5 of these lifestyle areas, the expectancy is increased 6.52 or 28.15 years. Finally, the addition of 6-7 health practices makes it possible to extend life 33.08 or until 78.08 years of age. In point of fact, we learned that there’s a very definite relationship between health practices (as arbitrary as they are) and length of life. Additionally, we note that such predictions can be made for both men and women at different ages (lines 2-12).
Table 1–Average Remaining Lifetime Using Death Rates of Three Health Practice Groups and California Life Table, 1959-1961
| line | sex | age | number of health practices | California 1959-1961 | ||
| 0-3 | 4-5 | 6-7 | ||||
| 1
2 3 4 5 6 7 8 9 10 11 12 |
men
men men men men men women women women women women women |
45
55 65 75 85 90 45 55 65 75 85 90 |
21.63
13.77 10.61 7.43 6.47 3.19 28.58 20.02 12.35 8.63 4.63 3.23 |
28.15
20.21 13.71 10.23 5.82 3.19 34.08 25.11 17.30 11.70 7.50 4.31 |
33.08
24.95 17.41 11.22 5.04 3.19 35.84 27.83 19.87 12.50 7.61 5.10 |
27.56 19.73 13.31 8.33 4.93
33.14 24.60 16.73 10.04 5.46 |
What can one anticipate when one sharpens the question of predictability? A case in point. What is the relationship of “when” and not “what” one should eat?
The Nibbling Effect
Somehow we’ve gotten it into our heads that a good diet means three squares a day. As far as we can ascertain, it makes no homeostatic sense. All of the evidence (and one must admit it isn’t plentiful) suggest that nibbling is the most stabilizing method of ingestion of food and drink.
Doctor Paul Fabry has shown,4 as have others, unequivocal evidence of some of the normalizing benefits of eating smaller amounts more frequently. His work suggests, if one were to consume one sixth of the food six times in a given day that one ordinarily eats one third of thrice daily, the clinical and physiologic profits would be unbelievable. There would be when indicated, weight loss, reduction in serum cholesterol, and an improvement in the glucose tolerance pattern.
What’s especially exciting is that he made these pronouncements in 1964.
What’s also noteworthy is that the concept has been rediscovered in 1989 and published in the New England Journal of Medicine.5 The claim now is that nibbling may be healthier for the heart than the conventional three-meal-a-day gorging. Researchers from the University of Toronto now tell us that snacking all day rather than eating three big meals may lower blood cholesterol. These researchers contend that cholesterol levels may be reduced by increasing meal frequency alone with no alteration in the nature or amount of the food eaten.
In this particular study, seven men ate 2500 calories a day. For one two week period, they got their food in three ordinary size meals. For the next fortnight, they received the same amount of calories in 17 daily snacks eaten once an hour. The nibbling diet lowered their cholesterol by 9% and their levels of hazardous low-density lipoprotein cholesterol, or LDL, by 14%. Not to be ignored is the observed decline in insulin by approximately 28%, and the urinary cortisol levels by an order of 17%.
The important point is that these subjects were not provided with any of the usual special low cholesterol diets.
One must wonder as to how much more predictive the HPL observations would be if nibbling were included as a health practice.
The point of these two studies is that, under physiologic conditions, made possible not by what one eats but how one eats, there’s a striking steady state. As or more important is the fact that the steady state is likely even more stable than envisaged by the earlier investigators such as Cannon and Bernard.
What About Raw Foods?
The evidence earlier described (Part 5 of this series) is bountiful that the passage of food from the garden-to-the-gullet undergoes extraordinary changes. The problems of soil quality, species, transportation and storage, processing, purchasing, rinsing, defrosting all alter nutrient content significantly.6 Of all of the steps mentioned, the cooking of foods (which in essence is the problem of heat) plays one of the most significant roles in nutrient state. After all, it’s noteworthy that man is the only creature in the animal kingdom that heats food! Hence, it’s interesting to ruminate on the possible virtues of raw foods in the homeostatic phenomenon.
First and foremost, one must admit that not much has been written on the subject. Secondly, what little there is centers largely upon the effect of a raw food regime in the diabetic patient.
Two case reports appeared in 1975 making the point that when the diabetic diet is modified to 50% and 80% of uncooked foods, the insulin requirements were significantly reduced.7,8 The next year, several case reports confirmed the earlier desirable effects of raw foods, Whether the benefits were due to increased transit time or fiber or the lack of destruction of enzymes is not dear. What’s evident is that uncooked foods in some way contribute to homeostasis.
While diabetes, blood sugar and insulin have received principal attention, unheated foods have been examined with regard to other areas.
A study examined responses to cooked and uncooked food in 32 outpatients with essential hypertension.9 By varying the raw food percentages and salt intake, patients acted as their own control subjects in this unblinded study. After a mean duration of 6.7 months, average intake of uncooked food comprised 62% of calories ingested. There was a convincing average diastolic pressure reduction of 17.8 mm Hg.
There’s more to the story.
It’s appropriate, and incidentally refreshing, to learn of increasing interest in specific factors in raw foods which exert homeostatic repercussions. Its now known that ellagic acid in strawberries and other fruits may well serve as an anticarcinogenic agent.10
However, before we exit on blood pressure, it might be well to point out that much discussion continues regarding the solution to this epidemic problem of hypertension. There are those who contend that protein supplementation elevates blood pressure while others argue that protein lowers it or exerts no effect.
We’ve looked at this controversial subject by means of a study of 44 presumably healthy junior dental students.11 Blood pressure was recorded in all subjects by one examiner at 10:00 A.M. on Monday of a week. On a random basis, one-half of the students were given 40 gm. per day of a protein (amino acid) supplement. The remaining 22 students received 40 gm. daily of an indistinguishable placebo (methylcellulose). The blood pressure was retaken Friday of the same week at 10:00 A.M. by the same examiner, with no knowledge of the original values or the type of supplementation.
The results are noteworthy. First, there was only a statistically significant mean reduction in systolic and diastolic blood pressure in the protein-treated group. The systolic initial scores of 120.3 ± 8.8 decreased to 114.7 ± 7.8. The diastolic values dropped from 72.3 ± 6.4 to 68.5 ± 4.4. Secondly, the standard deviations decreased in the protein-supplemented group and more significantly with regard to diastolic pressure. Thirdly, this convincingly indicates that the marginally low blood pressures rose while the borderline highs declined underscoring the homeostatic benefits of protein supplementation under these conditions. In other words, these observations point to a treatment for subclinical high blood pressure! Finally, this experiment adds to the general body of facts suggesting that the steady state is likely more steady than generally held.
The Role of Vitamins in the Health/Homeostasis Equation
There are many other (too many in fact to report here) examples of orthomolecular exercises. One good demonstration centers around glucose tolerance testing (GTT).
In traditional circles, it’s held that about one percent of people have diabetes mellitus and know it; one percent have it and don’t know it. In contrast, in some of the alternative communities, there are claims that up to 25% of presumably healthy people at one time or another during their lifetime may demonstrate hyperglycemia indistinguishable from that noted in maturity-onset diabetes mellitus. Obviously, if the blood sugar is inordinately high, then the diagnosis of diabetes mellitus is relatively simple. It’s in those instances, described best as the grey area, when the GTT is indicated. Essentially, it consists of a challenge to the system to determine whether the homeostatic picture can be destabilized.
To demonstrate this point, 169 presumably healthy persons, drawn at random, participated in this experiment.12 Carbohydrate metabolism was studied in each person by means of the cortisone glucose tolerance test (CGTT) which, at that time, was considered to be the most sophisticated measure of carbohydrate metabolism.
As an aside, from a search of the literature, there seems to be no argument that age parallels a decrease in glucose tolerance (meaning an elevation in blood glucose). The question to be resolved is whether the pattern is part of the physiologic aging process or signifies pathosis (namely, a disruption of homeostasis).
Most authorities do not regard the age-blood glucose correlation as representing a grossly pathologic state. The justification for this point of view is based principally on comparatively large numbers of elderly persons, not grossly ill, who show a decrease in glucose tolerance. However, there are others who contend that abnormal glucose tolerance at any age is pathologic. These authorities argue that the common occurrence of an increase in blood sugar with age simply reflects the presence of a common disturbance in carbohydrate metabolism.
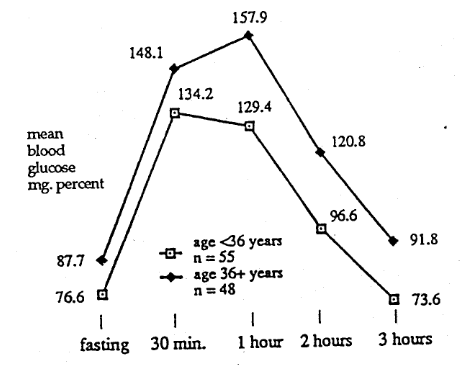
Figure 1–Cortisone Glucose Tolerance Group of P.A.A.<0.6 mg. Percent
Figure 1 shows the 55 subjects under the age of 36 versus the 48 (36+ years of age) in those individuals characterized by a relatively low (poorer) vitamin C concentration (<0.6 mg%). At every temporal point, at least on a mean basis, the older subjects seem to have higher blood glucose scores. This is supported in Table 2 where one finds statistically significant differences of the means at almost every temporal point along with considerable evidence of a difference in variance.
Table 2–Significant Differences of the Means and Variances: Plasma Ascorbic Acid Level
| <0.6 mg. percent; age <36 years versus age 36+ years | ||||
| cortisone glucose tolerance test | age <36 years (n=55)
mean and S.D. |
age 36+ years (n=48)
mean and S.D. |
significant difference of the | |
| means | variances | |||
| fasting
30 min 1 hour 2 hrs 3 hrs |
77 ± 13
134 ± 27 129 ± 40 97 ± 32 74 ± 30 |
88 ± 16
148 ± 43 1578 ± 55 121 ± 51 92 ± 46 |
*
* * * |
* * * * |
*statistically significant
This study, therefore, supports the published data by showing a significant parallelism between vitamin C metabolism (as measured by the plasma ascorbic acid level) and the carbohydrate picture (as judged by the CGTT). However, the observations reported here are at variance with published literature. Other investigators have shown a linear relationship between vitamin C and carbohydrate metabolism, namely. the lower the ascorbic acid level, the lower the glucose tolerance. In contrast, this experiment indicates that a relatively low level of vitamin C can be correlated with either relative hypo- or hyperglycemia. Hence, our data suggest that the commonly noted progressive decrease in blood sugar with age does indeed occur in individuals with relatively poor plasma vitamin C state.
In contrast, Figure 2 depicts the glucose tolerance patterns in the relatively younger and older groups with a more satisfactory vitamin C condition. Table 3 confirms that there are no major differences. Hence, our evidence confirms that the glucose tolerance pattern does not become poorer with advancing age in individuals with more physiologic plasma vitamin C concentration.
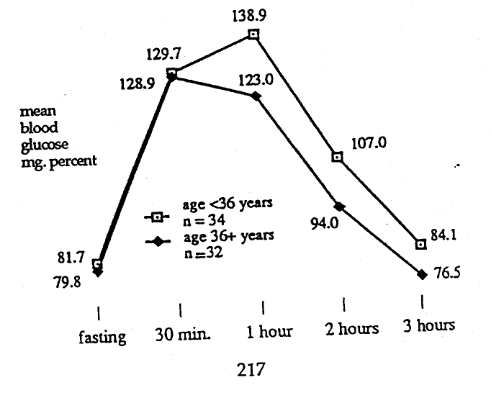
Figure 2–Cortisone Glucose Tolerance Group of P.A.A.>0.6 mg. Percent
Table 3–Significant Differences of the Means and Variances: Plasma Ascorbic Acid Level
| >0.6 mg. percent; age <36 years versus age 36+ years | ||||
| cortisone glucose tolerance test | age <36 years (n=34)
mean and S.D. |
age 36+ years (n=32)
mean and S.D. |
significant difference of the | |
| means | variances | |||
|
fasting 30 min 1 hour 2 hrs 3 hrs |
82 ± 12
12 ± 30 123 ± 32 94 ± 23 77 ± 21 |
80 ± 16
130 ± 23 139 ± 35 107 ± 32 84 ± 29 |
* * |
|
*statistically significant
Water as a Homeostatic Agent
Much has been written about diet with principal emphasis on what to eat, less consideration (as we have just learned) on when to eat; practically no attention has been directed to water, how much and when to consume it.
The importance of fluids in homeostasis has been known for a long time. In fact, even we’ve made reference to fluid balance earlier in this monograph (Part 2 of this series).
Just a few startling bits of information…
- losing only 1% of fluids can cause thirst or pain
- a 5% decrease invites hallucinations
- with a drop of 15%, there’s death!
So, we’re dealing with a powerful homeostatic system. But, there are, with advancing civilization, increasing and devastating abuses…
- Four out of five adults drink coffee, and they each average 3⅓ cups a day.
- Each person consumes about a bottle of pop a day. To be precise, that’s three times as much as he/she drank in 1954.
- Would you believe about a century ago, the typical American imbibed three bottles of pop a year!
On the basis of the relatively meager information we have, how much water should we consume, and when should we consume it?
According to the experts, the minimum amount you should ingest is 10 eight-ounce glasses a day. And you need to consume more if you’re overweight, exercise a lot or live in a hot climate. Obese people should drink an extra glass for every 25 pounds they exceed their ideal weight.
At the International Sportsmedicine Institute (ISI), where they monitor Olympic and professional athletes from around the world, they have developed a formula for water intake that accommodates athletes and nonathletes alike.13 They suggest a daily water intake of ½ ounce per pound of body weight if you’re a nonactive person (that’s 10 eight-ounce glasses a day if your weight is 160 pounds), and ⅔ ounce per pound if you’re an active, athletic person (13 to 14 eight ounce glasses a day if you’re 160 pounds). This ISI formula, inspired by East German physicians, has been used with great success for almost two decades.
It’s pretty obvious from the data presently available that most of us would fare better if we increased our water consumption. However, what has not yet been alluded to is when and how fluid can be consumed. The general consensus is that one should not drink more than four glasses of water per hour. (Please, no gorging.) Hence, in summary, water, like food, should be nibbled!
You may have gotten the idea that we need a lot more water than most of us believe. You’re right! You may also sense that we had better drink more fluids. You’re wrong! We can get much of what we need by, in effect, “eating” fluids.
- the water content of cucumbers is 96%
- lettuce is just below that with 95%
- on the other hand, pretzels have only 8% water
- and would you believe, popcorn is a mere 4%.
Negative Lifestyle Considerations
We’ve been discussing the positive contributions of the air we breathe, the water we drink, and the food we eat upon homeostasis. Thus far, no consideration has been given to the direct or indirect negative effects upon steady state.
Much has been written to suggest the deleterious influences of tobacco upon health and homeostasis directly (e.g. cancer). We wish here to consider a rarely discussed relationship of tobacco consumption to diet.
Dietary intake and daily tobacco consumption were assessed in approximately 700 members of the health professions.14 There was no difference in daily caloric consumption. However, of the 34 items studied, statistically significant differences were noted in 12 (Table 4). With regularity the vitamin and mineral intakes were higher in the relative nonsmokers. Conversely, sugar intake was significantly greater in those consuming the larger number of cigarettes (line 1).
Table 4–Dietary Intake and Daily Tobacco Consumption
| lines | factor | 0-10 cigarettes per day | 11+ cigarettes per day | percentage difference |
|
1 2 3 4 5 6 7 8 9 10 11 12 |
refined carbohydrate intake (gm)
potassium (mg) vitamin B-12 (mcg) vitamin C (mg) vitamin B-2 (mg) vitamin E (units) pantothenic acid (mg) percentage poly-unsaturated to saturated fat vitamin B-6 (mg) leucine (mg) valine (mg) total protein |
74 2089 13.0 333 6.3 79 18.0 15 4.6 7670 5574 104 |
110
1479 10.1 267 5.1 65 15.1 13 4.0 7034 5105 96 |
48* 29* 22* 20* 19* 18* 16* 16* 13* 8* 8* 7* |
*statistically significant
This study does not answer the question of cause and effect. Is the tobacco the cause of the different eating habits or is it the different diet that creates the need for tobacco? Notwithstanding, here is additional evidence to underscore the possible destabilizing effect of diet upon homeostasis mediated by tobacco consumption.
But, tobacco is only a very small part of the negative picture. What other negatives are there?
There’s no argument but that high levels of lead contribute to serious health problems. This subject has been earlier discussed (Part 6 of this series). It’s also been recognized that lead can be easily acquired in food, water and air. However, what is now becoming increasingly evident is that lead exposure heretofore considered low may be associated with obvious and serious clinical problems.
The most outstanding reports have been presented at the Society for Pediatric Research/ American Pediatric Society in Washington, D.C. in May 1989 and subsequently published in the New England Journal of Medicine15 and JAMA.16 Needleman and his colleagues indicate that low level lead exposure is significant and is manifested by a higher risk of dropping out of high school, reading disability, lower class standing, increased absenteeism, lower vocabulary and grammatical-reasoning scores, poorer hand-eye coordination, longer reaction times, and slower finger tapping.
What is also disturbing is the permanency of these problems
But what is most significant is that there is presently a school crisis as judged by student performance. The present thrust is to try to solve our educational weaknesses with more schools, higher quality teachers, and sophisticated tools. From what has just been stated, it might well be that the educational crisis can, at least in part, be resolved by dealing with the lead issue.
In summary, according to the Centers for Disease Control,17 and in their own words, “Among lead’s most insidious effects is its poisoning of the developing nervous system, as measured by a decrease in the IQs of children with even low-level lead exposure…for the nation, 81% of the total IQ loss occurred among children with low lead levels, children who were probably asymptomatic and identifiable only by screening.”
Physical Activity
You might, and justly, get the idea that the only practical modulators for homeostasis are dietary. At least, thus far, practically all of our examples seem to suggest just that. Not true. What’s correct is that most of the reported studies of homeostasis regulation deal with diet. Additionally, the majority of our own work and therefore our own bias is a confirmation. However, there’s other evidence and of a nondietary nature that can serve as a practical example of homeostasis control.
This is a story originally presented at the Seventh Congress of the International Diabetes Federation in Buenos Aires on 28 August 1970.18 Blood glucose levels were monitored continuously for 24 to 39 hours in 28 normal subjects and 15 insulin-dependent diabetic patients. During the period in which the participants took standardized exercise consisting of half-mile walks at four mph, one at 2½° and two at 5° slope, the decrement in glucose doubled (mean 11.7 mg%). The average decrease in blood glucose among diabetic patients was statistically significantly greater than that of the control group at both levels of exercise; 24.5 mg% at 2½° and 30.0 at 5°. In other words, the more severe diabetic demonstrated the more pronounced blood glucose reduction.
These findings demonstrate the significant effect of a brisk half-mile walk on blood glucose levels in insulin-dependent diabetes and support the clinical observations of the importance of exercise in diabetic homeostasis.
There are even more simple and widespread demonstrations of the role of motion on homeostasis. A study of 60 elderly healthy subjects shared in this fascinating experiment.19 Thirty served as controls; the other 30 performed carefully-supervised t’ai chi. The immune system was measured prior to and after t’ai chi in both groups. Immediately after a bout of t’ai chi, a marked increase of active T-lymphocytes occurred. Here’s an exciting confirmation of the effect of simple motion upon the immune system in particular and homeostasis in general.
Summary and Conclusions
Among many practitioners and even researchers, the realistic approach to homeostasis centers around the air we breathe, the water we drink, and the food we eat. Some investigators have developed more precise measures of health practices, demonstrated especially at the Human Population Laboratory in California.
But it’s for certain that these stories are incomplete. When and how we eat is obviously important and the new thing, as it were, is the search for specific agents to promote homeostasis.
The question before us is where does one begin to improve homeostasis? Phrased another way, is there a special simple diet that can serve as a starting point? The next section (Eight) in this series will look at this problem in some detail.
References Cited:
- Cheraskin, E. Health and Happiness. BioCommunications Press: Wichita, 1989.
- Belloc, N.B. “Relationship of Health Practices and Mortality.” Prev. Med., 1973; 2: 67-81.
- Wiley, J.A. and Camacho. T.C. “Life-Style and Future Health: Evidence from the Alameda County Study.” Prev. Med., 1980; 9:1-21.
- Fabry, P., Fodor, J., Hejl, Z., Braun, T., Zuolankova, K. “The Frequency of Meals: Its Relation to Hypercholesterolemia and Decreased Glucose Tolerance.” Lancet, 1964; 2: 614-615.
- Jenkins, D.J.A., Wolever, T.M.S., Vuksan, V., Brighenti, F., Cunnane, S.C., Rao, A.V., Jenkins, A.L., Buckley, G., Patten, R., Singer, W., Corey, P., and Josse, R.G. “Nibbling Versus Gorging: Metabolic Advantages of Increased Meal Frequency.” NEJM, 1989; 321: 929-934.
- Cheraskin, E, Ringsdorf, W.M., Jr., and Clark, J.W. Diet and Disease, Rodale Press: Emmaus, Pennsylvania, 1968 (hardback). Keats Publishing: New Canaan, Connecticut, 1977 (paperback).
- Douglass, J.M. “Raw Diet and Insulin Requirements.” Annals of Internal Med., 1975; 82: 61-62.
- Douglass, J.M. and Rasgon, I. “Diet and Diabetes.” Lancet, 1976; 2: 1306.
- Douglass, J.M., Rasgon, I.M., Pleiss, P.M., Schmidt, R.D., Peters, S.N. and Abelmann, E.A. “Effects of a Raw Food Diet on Hypertension and Obesity.” S. Med. J., 1985; 78: 841-844.
- Mandal, S., Shivapurkar, N.M., Galati, A.J., and Stoner, G.D. “Inhibition of N-nitrosobenzylmethylamine metabolism and DNA binding in Cultured Rat Esophagus by Ellagic Acid.” Carcinogenesis, 1988; 9: 1313-1316.
- Ringsdorf, W.M., Jr., and Cheraskin, E. “Protein Supplementation and Blood Pressure.” Lancet, 1964; 84: 54-56.
- Setyaadmadja, A.T.S.H., Cheraskin, E., and Ringsdorf, W.M., Jr. “Ascorbic Acid and Carbohydrate Metabolism. I. The Cortisone-Glucose Tolerance Test.” J. Am. Geriatric Soc., 1965; 13: 924-934.
- Perry, L.R., Jr. “Are You Drinking Enough Water?” The Birmingham News. Parade Mag., 1989; October.
- Cheraskin, E., Ringsdorf, W., Jr., and Medford, F.H. “Eating Habits of Smokers and Nonsmokers.” J. Int. Acad. Prev. Med., 1975; 11: 9-17.
- Needleman, H.L., Schell, A., Bellinger, A., Leviton, A., and Allred, E.N. “The Long-Term Effects of Exposure to Low Doses of Lead in Childhood: An 11-year Follow-up Report.” NEJM, 1990; 322: 83-88.
- Needleman, H.L. and Gatsonis, C.A. “Low-Level Lead Exposure and the IQ of Children: A Meta-Analysis of Modem Studies.” JAMA, 1990; 263: 673-678.
- Sacks, J.J. and Binder, S. “Points of Potential IQ Lost from Lead.” (Letter to the Editor). JAMA, 1990; 264: 2212.
- Klachko, D.M., Lie, T.H., Chase, G.R, and Burns, T.W. “Blood Glucose Levels During Walking in Normal and Diabetic Subjects.” Diabetes, 1990; 21: 89-100.
- Xusheng, S., Yugi, X. and Yunjian, X. “Determination of E-Rosette-Forming Lymphocytes in Aged Subjects with Taichiquan Exercise.” Int. J. Sports Med., 1989; 10: 217-219.