
Access to all articles, new health classes, discounts in our store, and more!
Daily Vitamin C Consumption and Reported Respiratory Findings
Published in International Journal for Vitamin and Nutrition Research, Vol. 43, No. 1, pp. 42-55, 1973.
* * *
Summary: Five hundred twenty-seven dental practitioners and their wives were studied on one occasion in terms of reported daily vitamin C consumption and reported respiratory symptoms and signs. From this group, 83 subjects were reexamined one and two years later following group nutritional seminars. Five points are apparent. First, there is a statistically significant negative correlation between daily vitamin C intake and respiratory findings. In other words, as vitamin C intake rises, respiratory symptoms and signs decline. Second, following group nutritional seminars, respiratory symptoms and signs decline during the next two years. Third, during this same time period, vitamin C consumption rises. Fourth, the most significant change in respiratory findings occurred in the group characterized by the greater increase in vitamin C intake. Finally, the evidence suggests that vitamin C may be viewed as a resistance agent for respiratory disease because its introduction tends to discourage the appearance of respiratory symptomatology.
Introduction
Doctor Pauling cites several studies in medical and scientific literature showing beneficial effects of vitamin C used against colds.12
But the staff of Nutrition Reviews, a technical journal, searched the medical and scientific literature and concluded in an article in the August 1967 issue that: ‘There is no conclusive evidence that, in the absence of severe ascorbic acid depletion, ascorbic acid has any effect on the incidence, course, or duration of the common cold.’
This citation from The National Observer3 reflects the present state of confusion regarding vitamin C and the common cold. The purpose of this report is to analyze the relationship of reported daily ascorbic acid intake and reported respiratory symptoms and signs in a presumably healthy sample of individuals with the hope that the findings may cast some light on the resolution of the present controversy. Accordingly, an attempt will be made in this report to answer the following seven questions:
- What is the frequency of reported respiratory findings in a presumably healthy population?
- What is the daily vitamin C consumption in this same group?
- Is there any relationship between the frequency of reported respiratory symptoms and signs and daily ascorbic acid intake?
- What changes in the frequency of reported respiratory symptoms and signs occur during a one- and two-year experimental period following group nutritional improvement instruction sessions?
- What alterations in daily ascorbic acid intake occurred during this same interval?
- Are there any parallelisms between the reported respiratory findings and the daily vitamin C consumption?
- What are the possible significances of these findings?
Method of Investigation
In 1965, a multiple testing health program for members of the health professions was inaugurated under the auspices of the Southern Academy of Clinical Nutrition. In 1969, the project was extended to include a group designated as the Southern California Academy of Nutritional Research, and a third group was organized under the aegis of the Ohio Academy of Clinical Nutrition. Finally, in 1971, a fourth segment was added under the direction of the Northeast Academy of Clinical Nutrition.
Five hundred twenty-seven dental practitioners and their wives were studied initially between 1965 and 1971 in terms of reported dietary state and reported clinical state. A clinical score for respiratory symptoms and signs was derived from the Cornell Medical Index Health Questionnaire.2 The daily vitamin C intake was obtained from a food frequency questionnaire.1 It became clear that many of the participants were consuming large amounts of refined carbohydrate foodstuffs, suboptimal amounts of protein, and relatively small quantities of vitamins and minerals. The therapeutic regimen consisted of several brief nutritional seminars showing the dietary deficits and methods for dietary improvement.4,9
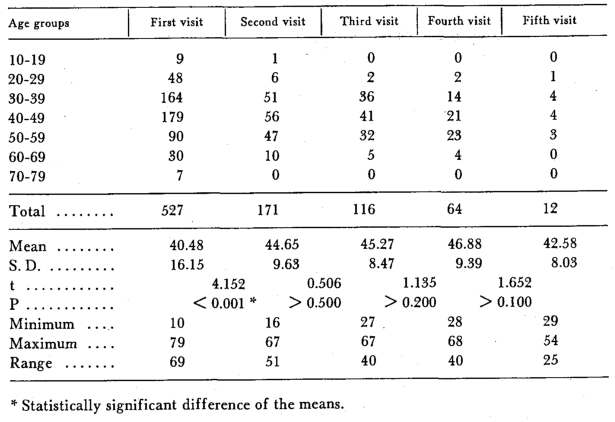
At each of the five examination visits, the age and sex was recorded. Table 1 is a summary of the age distribution at each session. Parenthetic mention should be made that the ten readings in the second decade represent children of the dental families.
Tab. 1: Age distribution
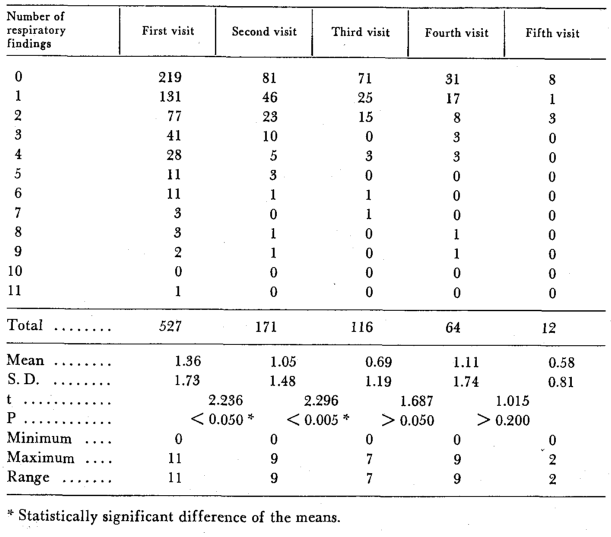
On each occasion, each subject completed the Cornell Medical Index Health Questionnaire.2 Section B (eighteen questions) relates to the respiratory system. The distribution of positive (pathologic) responses for the five examination sessions is summarized in Table 2.
Tab. 2: Reported respiratory findings
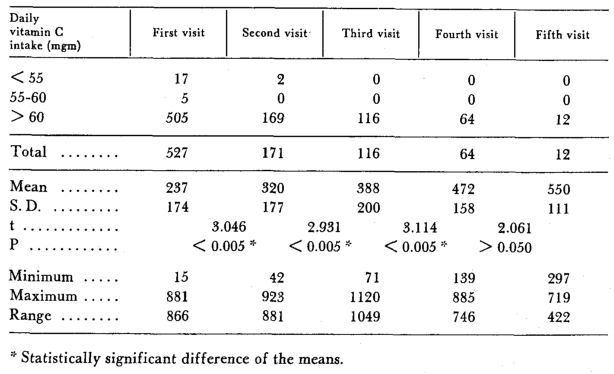
At each visit, every participant completed the Dietronic Dietary Analysis.1 This is a dietary questionnaire based upon food consumption frequency. The completed form is submitted to a computer center and a readout is provided. For purposes of this study, only the daily vitamin C intake was utilized. The distribution at each examination is shown in Table 3.
Tab. 3: Daily vitamin C consumption
Results
Question One: Table 2 summarizes the frequency of reported respiratory findings for the entire sample of 527 subjects at the initial examination and for all subjects at the four subsequent examination periods. It will be noted that, on the average, each subject initially reported 1.36 positive respiratory responses. Hence, in answer to the first question, reported respiratory symptoms and signs range from zero to eleven with a mean of 1.36.
Question Two: Table 3 outlines the daily vitamin C consumption for the entire sample of 527 individuals at the first analysis and for those at the four subsequent examinations. The mean intake initially is 273 mgm. per day. According to the Food and Nutrition Board of the National Council,11 the recommended intake for the male is 60 mgm. per day, and the requirement for the female is 55 mgm. per day. On this basis, about 95 per cent of the group are taking adequate amounts. Hence, according to the Recommended Dietary Allowances, and in answer to the second question, this group is consuming approximately four to five times more C than is officially recommended.
Question Three: Table 3 shows that 527 subjects participated at the initial examination and 171, 116, 64, and 12 at subsequent annual sessions, making a total of 890 experiences. Figure 1 pictures the relationship between the frequency of reported respiratory symptoms and signs (on the abscissa) versus the daily vitamin C intake (on the ordinate). On a mean basis, there is a progressive decline in respiratory findings in parallel with an increase in daily vitamin C consumption. It is clear, in answer to the third question, that there is a low but statistically significant negative correlation coefficient (r = -0.089, P < 0.01) meaning that the higher the daily vitamin C consumption, the fewer the respiratory findings.
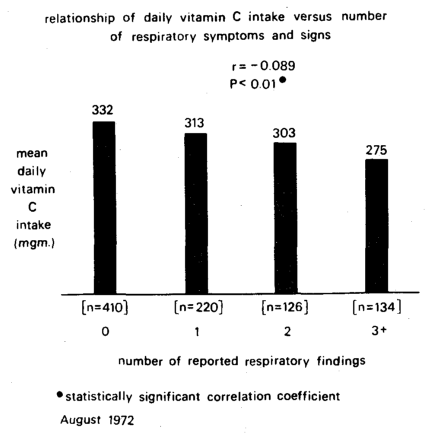
Fig. 1: The relationship of number of reported respiratory findings (on the horizontal axis) versus mean reported daily vitamin C intake (on the vertical axis) in 890 observations. On a mean basis, the increase in respiratory findings parallels the decrease in mean vitamin C intake. There is a low but statistically significant negative correlation (r = -0.089, P < 0.01).
Question Four: Following the initial survey, as previously noted, health education lectures were provided to the group. This included discussions of the existing dietary patterns and possible changes that could and should be instituted. The recent book by Doctor Linus Pauling, Vitamin C and the Common Cold, was included in the lecture materials.12 On an annual basis, the entire group was re-examined by the techniques (clinical and dietary) previously mentioned.
It is relevant to point out that well over three-fourths, actually 78.8 per cent of the group increased the daily vitamin C intake between the first and second visit (Table 4). The changes between subsequent visits are also shown.
Tab. 4: Changes in reported daily vitamin C consumption
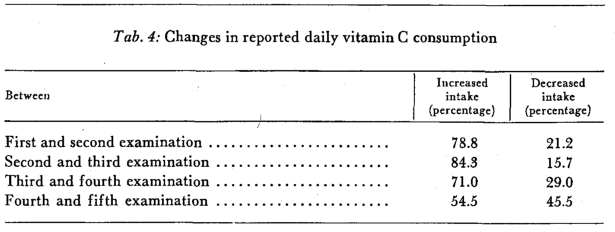
Table 2 lists the respiratory scores at each examination period. It will be observed that, initially, the mean respiratory score was 1.36; one year later the average score was 1.05. The average values were 0.69, 1.11, and 0.58 for the third, fourth, and fifth annual examinations respectively. Thus, overall, there was a statistically significant decline in clinical symptoms and signs between the first and second and the second and third examinations.
However, it should be pointed out that these findings represent the entire sample. One argument which can justly be raised is the fact that the initial and second year samples are substantially different. Part of the difference is attrition. However, part of the difference is due to the fact that one nutrition academy had not returned for reexamination.
For these and other reasons, it was thought desirable to examine those subjects (n = 83) who participated in each of the first three examination periods. Figure 2 summarizes the mean reported respiratory symptoms and signs (on the ordinate) at the first, second, and third examination periods (on the abscissa). Additionally, the sample has been divided into those who, at the third examination, were consuming less than 400 mgm. vitamin C per day (37 subjects pictured by the dotted line) versus those who were consuming 400+ mgm. vitamin C per day (46 subjects shown by the continuous line). Five points warrant special mention. First, on a mean basis, there is a reduction in respiratory complaints in both subgroups. This, it should be recalled, is consistent with the observations reported earlier (Table 2). Second, on a mean basis, the reduction in respiratory findings is greater in those who, at the third examination,, are consuming the greater amounts (400+ mgm.) of vitamin C. Third, there appears to be no statistically significant difference (t = 1.507, P > 0.100) at the start of the study. Fourth, while the groups are not substantially different at the start, they become progressively more different at the second (t = 2.831, P < 0.010) and at the third examination (t = 3.905, P < 0.001). Finally, there are no statistically significant differences in the lower (< 400) vitamin C intake group between visits as shown by a t = 1.535, P > 0.100 and a t = 1.303, P > 0.200. In sharp contrast, there are very clear-cut decrements in the group characterized by the greater daily vitamin C consumption at the third visit. This is underlined by the t = 2.963, P < 0.005 and a t = 3.490, P < 0.001. Thus, in answer to the fourth question, the most notable reduction in respiratory symptoms and signs seems to occur in the group characterized by the greater daily ascorbic acid consumption.
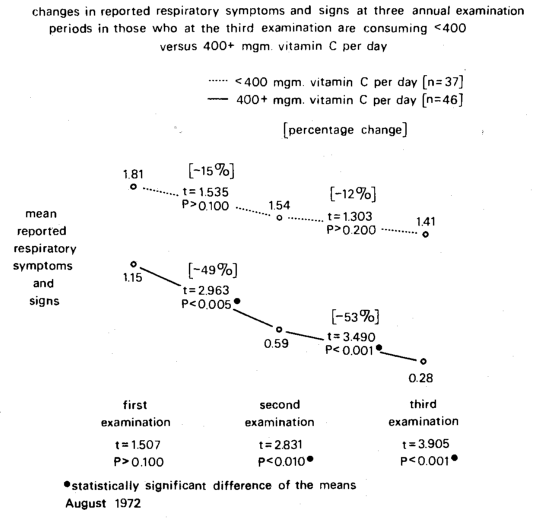
Fig. 2: The changes in reported respiratory symptoms and signs (in the vertical axis) at three annual examination periods (on the horizontal axis) in those who, at this third examination, are consuming < 400 (dotted line) versus 400+ (continuous line) milligrams vitamin C per day. On a mean basis, there is a decline in respiratory findings in both groups. However, the decrements are statistically significant only in the group characterized by the greater vitamin C intake.
Question Five: The obvious next point is to ascertain the changes in vitamin C intake during the same experimental periods. Figure 3 pictorially portrays the daily vitamin C intake (on the y-axis) at the three examination periods (the x-axis). Five points warrant special consideration. First, there is a progressive increase in the reported daily vitamin C intake in both groups. This supports the earlier reported data (Table 3). Interestingly enough, this is also quite in accord with clinical findings just reported (Figure 2). Second, on a mean basis, the increase in daily vitamin C intake is greater in those who, at the third examination, are consuming the greater amounts (400+ mgm.) of vitamin C. This is also in parallel with the observation reported elsewhere (Figure 2). Thus, the greater reduction in respiratory findings occurred in the group with the final higher vitamin C intake (400+ mgm. daily). Third, there appears to be no statistically significant difference (t = 1.591, P > 0.100) at the start of the study. It should be noted that this follows a similar pattern earlier mentioned (Figure 2). Fourth, while the groups are not substantially different at the start, they diverge at the second (t = 2.581, P < 0.025) and at the third examination (t = 11.568, P < 0.001). Again, it should be underlined that this corresponds to previous clinical observations (Figure 2). Finally, there are statistically significant differences in the lower (< 400 mgm. C daily) group between visits as shown by a t = 4.141, P < 0.001 and a t = 3.078, P < 0.005. However, greater statistically significant differences are shown in the group consuming 400+ mgm. of vitamin C daily. This is represented by a t = 5.118, P< 0.001 and a t = 9.901, P< 0.001. Hence, in response to question five, the more significant increase in vitamin C consumption appears to occur in the group who, at the third examination, is consuming the greater amount of daily ascorbic acid.
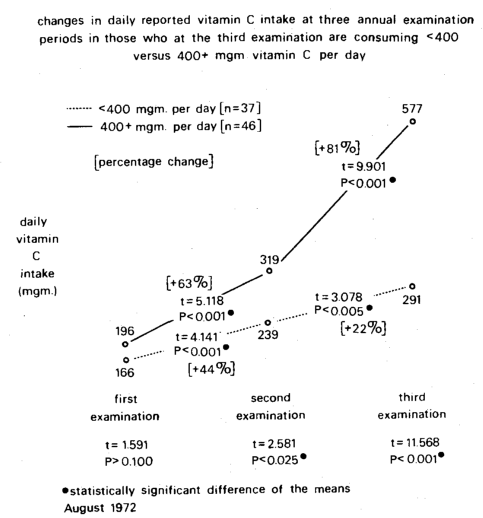
Fig.3: The changes in reported vitamin C intake (on the ordinate) at three annual examination periods (on the abscissa) in those who, at the third examination, are consuming < 400 (dotted line) versus 400+ (continuous line) milligrams vitamin C per day. On a mean basis, there is a rise in vitamin C consumption in both groups. However, the increments are more statistically significant in the group characterized by the greater vitamin C intake.
Question Six: It is not easy to provide a quick and simple answer to this particular question for a number of reasons. First, this is not basically a vitamin C study but rather a multiple testing program in which diet and clinical state have been related. Second, while many individuals increased their vitamin C consumption, some of these subjects also altered their diets in other ways. For example, it was learned that the refined carbohydrate consumption in the group was very high and that a significant number of the participants reduced their refined carbohydrate intake.8 Hence, the dietary changes were multifactorial. Notwithstanding, in answer to the sixth question, the evidence presented (Figures 2 and 3) suggests extraordinary parallelisms between the initial clinical and dietary patterns and their subsequent courses.
Discussion
Question Seven: Two interdependent points bear on the response to this final question. First, in the last analysis, health or disease is a function of the environment and the organism’s capacity to cope with the external milieu. The latter ingredient is termed host resistance and susceptibility. Analytically,13 resistance may be viewed as any agent which, when administered, tends to discourage the development of disease. When absent, however, it encourages disease. For example, vitamin B1 (thiamin) may be regarded as a resistance agent for its administration tends to discourage the development of beri-beri, and its absence causes it. In a sense, therefore, resistance agents are pluses. In contrast, a susceptibility agent invites disease when present and discourages the development of disease when it is withdrawn. Thus, sugar is to be viewed as a susceptibility agent because its introduction tends to encourage dental caries, and its absence exerts a preventive action. Hence, susceptibility agents are minuses. Parenthetic mention should be made that never is an agent a resistance factor for one disease and a susceptibility factor for another disease.5-7,10 Since vitamin C is known as a resistance agent for scurvy, it would seem that it should be a resistance agent for other syndromes. If sugar is a susceptibility factor in the mouth, it is for the whole body.
The other relevant point is the recognition that chronic disease is characterized by a long and insidious incubation period. For example, early in the development of the syndrome, there may be one or two seemingly unrelated symptoms and signs such as infrequent cough and slight uncommon expectoration (Figure 4). This is the box on the left. At this point, no textbook syndrome is evident. Hence, the symptom and/or sign is treated symptomatically. With time, the number of clinical findings increase and begin to localize in specific sites, organs or systems. This is the center box. At this point, no textbook designation is still possible. Hence, the patient is treated in one of three ways. Either each symptom and sign is treated separately. Second, if too many symptoms and signs prevail, a psychiatric diagnosis is made. Finally, in the third instance, the patient is put under observation. This is a polite way of telling the patient to go home and develop more findings so that he can fit the textbook picture of a particular syndrome. This is the box on the right. This is just as true in the case of respiratory pathosis as of any other system. The frequency of respiratory symptoms and signs utilized in this study represents the very beginning of the problem and is pictured in Figure 4 as the box on the left.
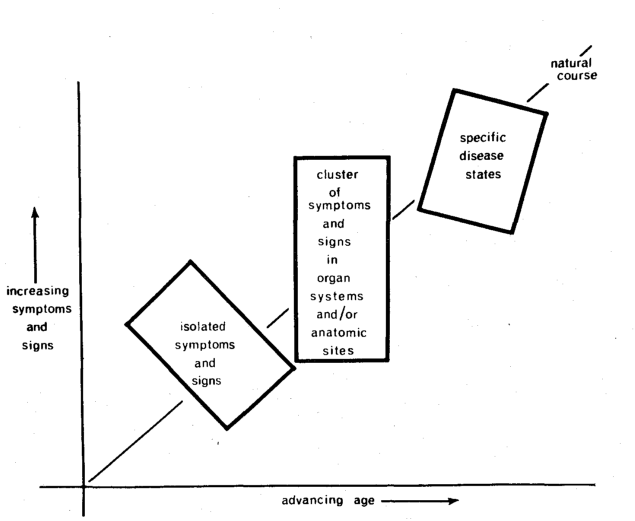
Fig. 4: The clinical sequence of events in chronic disease. At first, there are few and diverse symptoms and signs (box on the left). With time, the findings become more numerous and localized in a system or site (middle box). Finally, the clinical evidence fits the textbook picture of a particular disease or syndrome (box on the right).
With these two interdependent points in mind, it is well to evaluate vitamin C as a resistance or susceptibility agent with regard to the early development of respiratory pathosis. Figure 5 attempts to pictorially portray this situation. Shown on the ordinate is the mean daily vitamin C consumption. The group characterized by no respiratory findings consumed, on the average, 332 mgm. vitamin C daily (the stippled bar). In contrast, the group characterized by respiratory symptoms and signs consumed a mean of 299 mgm. vitamin C per day. This difference is statistically significant (t = 2.585, P < 0.010). Thus, in answer to the final question, the evidence suggests that vitamin C must be viewed as a resistance agent for respiratory disease because its addition tends to reduce the possibility of pathosis.
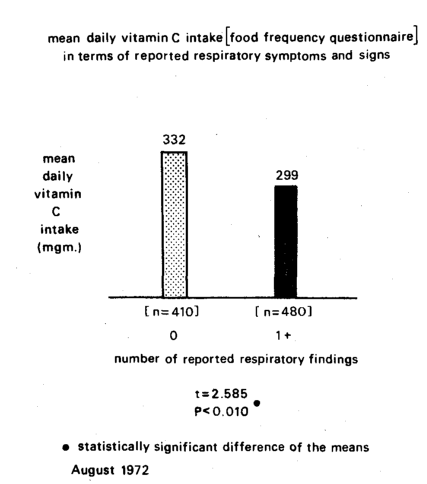
Fig. 5: The relationship of reported daily vitamin C consumption (as judged by the food frequency technique) and the frequency of reported respiratory findings. The group of subjects with no respiratory symptoms or signs (stippled column) shows a higher daily mean vitamin C intake (332 mgm) than the group with 1+ respiratory findings (black column). Hence, by definition, vitamin C may be regarded as a resistance agent since its addition discourages disease.
References Cited:
- Asramson, J. H., Slome, C. and Kosovsky, C.: Amer. J. Pub. Health, 53, 1093 (1963).
- Brodman, K., Erdman, A. J., Jr. and Wolff, H. G.: Cornell Medical Index Health Questionnaire. New York, Cornell University Medical College (1949).
- Buyer, B.: “Vitamin C as a cold remedy proposed anew.” The National Observer, 23 November 1970.
- Cheraskin, E. and Ringsdorf, W. M., Jr.: New Hope for Incurable Diseases. New York, Exposition Press (1971).
- Cheraskin, E. and Ringsdorf, W. M., Jr.: “The exercise profile” (submitted for publication).
- Cheraskin, E. and Ringsdorf, W. M., Jr.: “The mental illness proneness profile.” Alabama Journal Medical Sciences, 1973. (in press).
- Cheraskin, E. and Ringsdorf, W. M., Jr.: “The oral proneness profile” (in preparation).
- Cheraskin, E. and Ringsdorf, W. M., Jr.: J. Alabama Dent. Assn., 56, 32 (1972).
- Cheraskin, E., Ringsdorf, W. M., Jr. and Clark, J. W.: Diet and Disease. Emmaus, Pennsylvania, Rodale Books (1968).
- Cheraskin, E., Ringsdorf, W. M., Jr., Michael, D. W., Hicks, B. S. and Wright, W., Jr.: J. Amer. Soc. Prevent. Dent., 1, 26 (1971).
- Food and Nutrition Board: Recommended Dietary Allowances. Publication No. 1694. Seventh revised edition. Washington, National Academy of Sciences (1968).
- Pauling, L.: Vitamin C and the Common Cold. San Francisco, W. H. Freeman and Company (1970).
- Schneider, H. A.: Amer. J. Trop. Med., 31, 174 (1951).