Access to all articles, new health classes, discounts in our store, and more!
Analysis of Sixteen Dental Students Subjected to Tolerance Testing Methods of Investigation
Excerpted from “The intradermal ascorbic acid test: IV. A study of tolerance testing in sixteen dental students.” Journal of Dental Medicine, 14: #3, 131-155, July 1959.
* * *
Method of Investigation
Plasma ascorbic acid levels and intradermal decolorization test times were performed simultaneously in sixteen dental students. Plasma determinations followed the methods of Mindlin and Butler. The procedure for the intradermal test was that recommended by Slobody. Immediately following these determinations, one gram of ascorbic acid was administered intravenously to each of the students. The plasma ascorbic acid and intradermal time values were then redetermined fifteen minutes after the intravenous injection, and again at 24 and 48 hours postinjection. In addition, a history of smoking habits and dietary intake of citrus fruit juices was acquired. A dietary intake of three or less 6-ounce glasses per week of citrus juice or its equivalent was considered a poor citrus intake. A diet containing more than three 6-ounce glasses per week or its equivalent was accepted as a good citrus intake. The obvious role of citrus intake in the ascorbic acid status of man justified the dietary history. Smoking habits were recorded because of reports in the literaturewhich suggest that tobacco consumption alters the ascorbic acid concentration in the tissues.
Intradermal Tolerance Analysis: The intradermal tolerance data will be presented within the same framework as the previously described plasma tolerance analysis: (1) general characteristics, (2) relationship to smoking and citrus intake habits, and (3) relationship of initial to tolerance results.
General Characteristics: As the intradermal time becomes lower, ascorbic acid levels are increasing. Thus, Figure 7 which represents the average intradermal response of the sixteen dental students, is almost a mirror image of the general plasma ascorbic acid response to the intravenous injection of 1 gm. of ascorbic acid pictorially shown in Figure 1. Table 8 lists the statistical elements of the group reaction to the load dose. There is a statistical difference between the initial and 15 minute postinjection scores, and between the 15 minute and 24 hour scores. Thus, the general sequence is one of decline in time at 15 minutes, ascent at 24 hours and relatively no further change at 48 hours. The 48 hour scores are essentially not different from the original levels.
The variability (coefficient of variation) is slightly lower at 48 hours than initially although the index is essentially constant at each test period.
Relationship to Smoking and Citrus Intake Habits: Students were again grouped as discussed under plasma tolerance results. Intradermal tolerance curves have been developed for each of these groups.
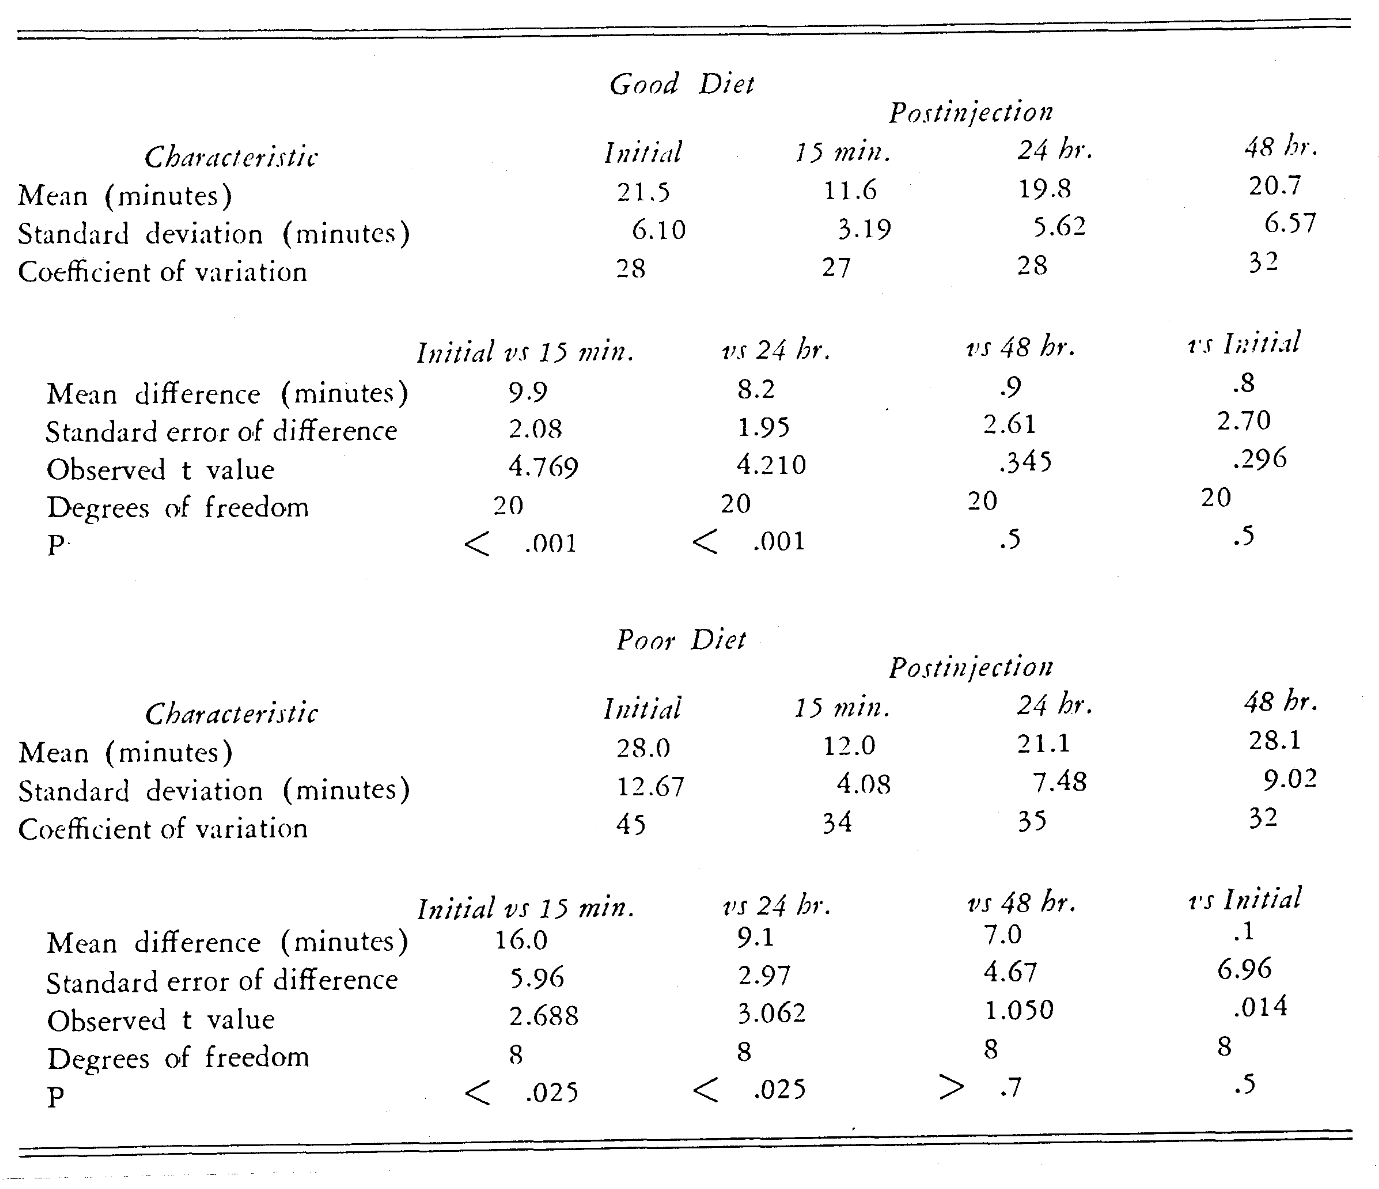
Citrus Intake: Figure 8 displays the comparative intradermal tolerance responses of persons on a good versus those on a poor citrus regime. To ascertain the truth of the plotted changes, one may take note of Table 9. Both groups show a decided drop in intradermal time at 15 minutes post injection and a significant upswing at 24 hours. Group differences from 24 to 48 hours are not significant.
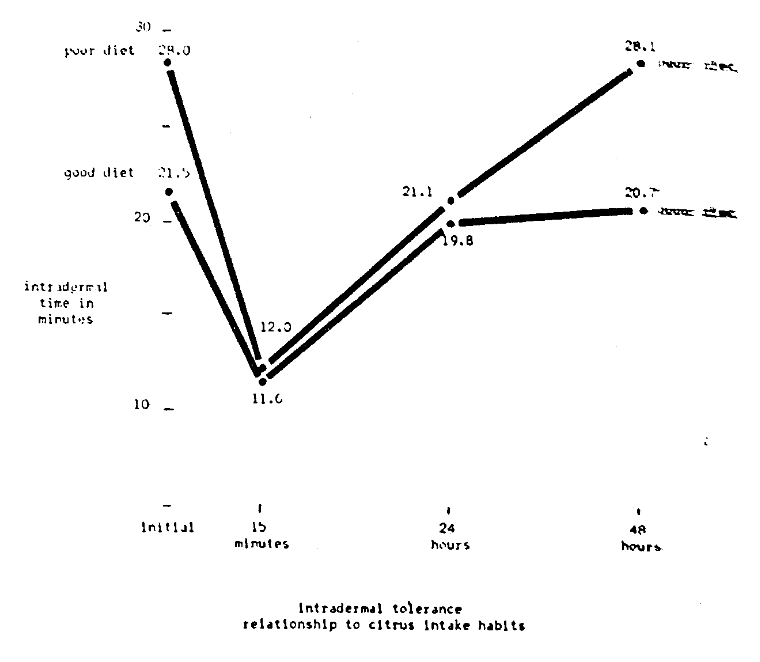
Figure 8
Table 9