
Access to all articles, new health classes, discounts in our store, and more!
Hormones and Hemopoiesis I. Posterior Pituitary Extract and Erythrocyte Count
Published in The Journal of The Medical Association of the State of Alabama, Vol. 31, No. 1, July 1961.
* * *
Introduction
The evidence seems clear that hemopoiesis is influenced by the hormones of the body.1 Also, there is general agreement that erythropoiesis is modified by virtue of a secondary hormonal effect upon general metabolism rather than a direct and specific hemopoietic action.2,3,1,5.6 However, a number of points remain unclarified. One area which has received scant attention is the hematologic effects of minimal hypo- and hyperactivity of the endocrine organs. Secondly, only brief study has been made of the relationship between the posterior hypophyseal secretions and erythropoiesis.
This report is designed to analyze the relationship of small doses of posterior pituitary extract upon hemopoiesis as measured by changes in the circulating erythrocyte count.
Review of the Literature
Both lower animal2,4,5,6,7,8,9,10,11,12 and human studies indicate that a moderate to severe anemia follows experimental and clinical hypopituitarism. Dodds and his group13,14 observed severe macrocytic anemia with marked reticulocytosis and hypochromia in guinea pigs and rabbits given large doses of posterior pituitary extract, These findings have been observed by other investigators.15,16,17 Davis18 noted that the daily administration of small amounts of posterior pituitary extract to both normal and splenectomized dogs and rabbits induced polycythemia in approximately one to three weeks Limited observations indicate that extirpation of the intermediate and posterior lobes does not produce an anemia.19
Method of Investigation
Forty male and female human subjects were studied with regard to the effect of small doses of posterior pituitary extract upon the circulating red blood cell count. Included in the group were ten male and 30 female subjects with a mean age of 50.9 and a standard deviation of 13.8 years. The participants in this experiment were chosen from a group of 683 persons as possible cases of mild posterior pituitary disease. An anthropometric technique, described elsewhere,20 constituted the method for classifying these individuals in the posterior pituitary group.
At the start of the experiment, all subjects were subsisting on a similar diet (low-refined-carbohydrate high-protein) as previously reported.21 Each participant in this study was given either 1/400 or 1/800 grain posterior pituitary extract orally once daily for periods ranging from three to 27 days. The posterior pituitary extract was prepared from 1/10 grain posterior pituitary extract (Armour) by appropriate dilution. It is of interest to mention that the doses utilized in this study are approximately 40 to 80 times smaller than the amounts generally prescribed for patients suffering with diabetes insipidus.22
There are, admittedly, elaborate techniques now available for the determination of erythropoiesis. Until very recently the only methods included the measurement of peripheral erythroid values, reticulocyte response, and bone marrow activity, These techniques, though not completely satisfactory, are certainly simple and practical. For purposes of this study only the circulating red cell count will be considered. Attention will be directed to the hemoglobin levels,23 hematocrit,24 mean corpuscular volume,25 mean corpuscular hemoglobin,26 and mean corpuscular hemoglobin concentration in subsequent reports.
Results
The data will be reported in two broad categories: (1) general characteristics for the entire group, and (2) subgroup analyses for the purpose of evaluating sex, and the effect of dose and duration of medication.
General Characteristics
Figure 1 graphically depicts (for the entire series of 40 subjects) the erythrocyte counts initially (on the abscissa) and the difference from the initial count (on the ordinate) after 3 to 23 days with posterior pituitary extract.
Simple inspection of Figure 1 suggests that the erythrocyte count changes with posterior pituitary extract administration. It appears that the highest red blood cell counts (>5,000,000) all seem to decrease. Also, it seems that the lowest erythrocyte counts (< 4,300,000) all rise. A statistical analysis of these findings indicates a coefficient of correlation of -.619 and a P<.001. Thus, there seem to be significant changes in the erythrocyte count after posterior pituitary extract administration <.001. Thus, there seem to be significant changes in the erythrocyte count after posterior pituitary extract administration.
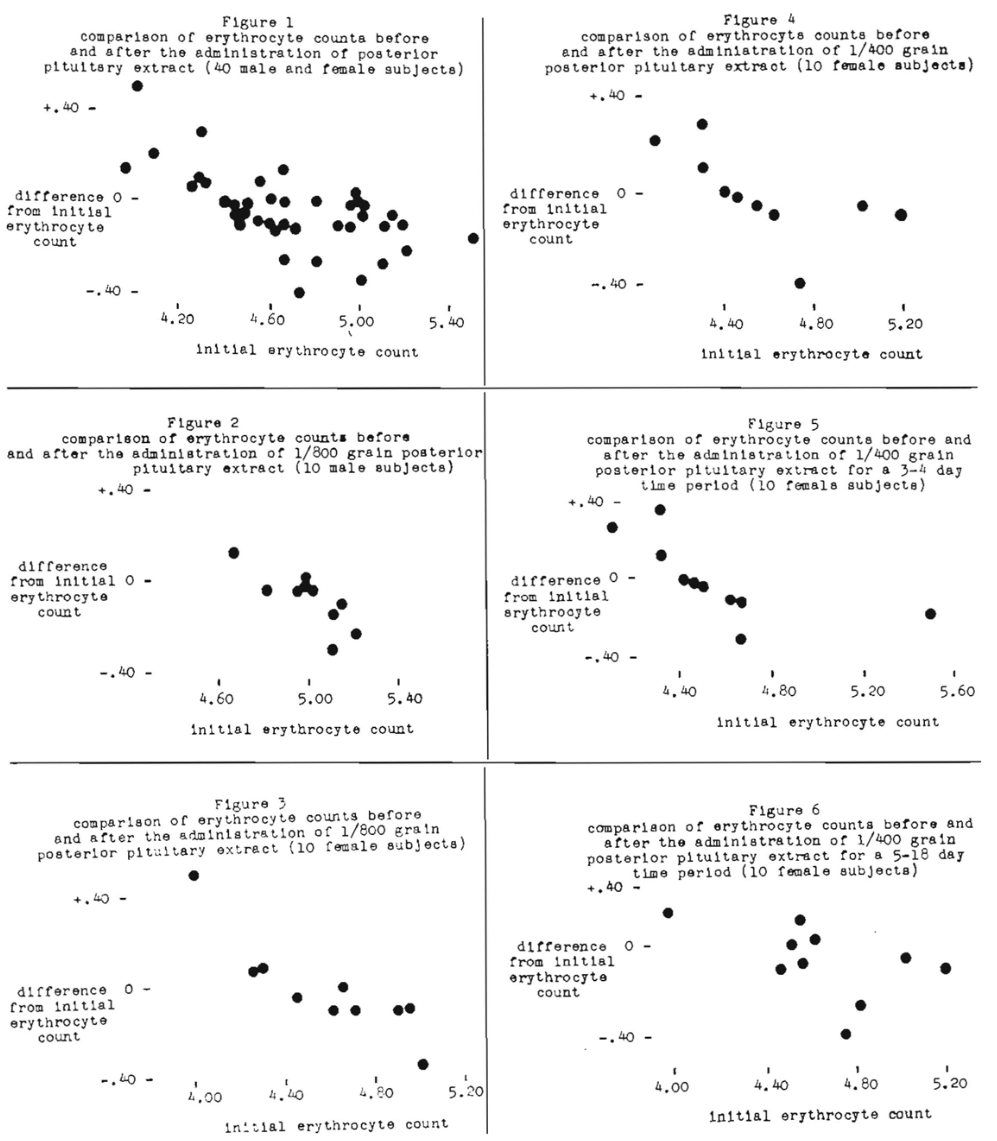
Figure 1, 2, 3, 4, 5 and 6
Subgroup Analyses
Sex Analysis: The group of 40 subjects included ten male and ten female patients who were given the same amount of posterior pituitary extract daily (1/800 gr.). Thus, a separate analysis was made of the changes in the erythrocyte count in the two sexes with the same medication regime.
Table 1 includes the original data. An examination of the ten male subjects given 1/800 grain posterior pituitary extract daily (Figure 2) shows that the subjects with red counts above 5,000,000 all decreased while, in the main, those below 5,000,000 rose. Thus, it would appear that the pattern previously noted for the entire group of 40 subjects obtains for the ten male subjects. These data were statistically studied and the coefficient of correlation of –.804 was found significant at the 5 per cent level.
Table 1–Effect of 1/800 Grain Posterior Pituitary Extract Upon the Erythrocyte Count
| patient number | age | sex | number of days of therapy | initial red cell count | final red cell count | difference in red cell count |
| 206
083 268 471 493 082 541 605 174 069 153 366 292 373 219 341 283 638 663 522 |
68
27 43 68 59 65 59 39 61 — 44 46 40 40 50 49 30 58 46 45 |
M
M M M M M M M M M F F F F F F F F F F |
3
4 4 4 5 5 6 8 15 17 2 4 4 4 6 6 7 9 11 14 |
5.10
5.15 4.65 5.10 4.95 4.80 5.20 4.98 5.00 4.97 4.65 4.30 4.45 4.70 4.60 5.00 4.25 4.90 4.95 4.00 |
5.00
5.10 4.80 4.85 4.95 4.80 5.00 5.00 5.00 5.00 4.65 4.40 4.41 4.60 4.50 4.65 4.33 4.80 4.85 4.50 |
-.10
-.05 +.15 -.25 .00 .00 -.20 +.02 .00 +.03 .00 +.10 -.04 -.10 -.10 -.35 +.08 -.10 -.10 +.50 |
Included also in Table 1 is the original information derived from a study of ten female subjects also given 1/800 grain of posterior pituitary extract daily. Basically, the pattern previously described for the male group obtains for the ten female subjects (Figure 3).In other words, the highest red cell counts (>4,700,000) decrease while the lowest ones (<4,400,000) rise with this particular hormonal regime. Also, a high coefficient of correlation was shown (-.879) and a P<.025. There is, however, one big difference in a comparison of the male and female groups. It should be recalled that the male red counts seem to migrate toward 5,000,000. A more detailed study of the female group demonstrates that the shift is toward 4,500,000.
Dose Analysis
Table 2 summarizes the findings in ten females subjected to 1/400 grain of posterior pituitary extract per day for three to 18 days. Table 2 also includes the data from ten females administered 1/800 grain of posterior pituitary extract per day for two to 14 days. Thus, an opportunity is provided to study the relationship of the changes in the erythrocyte count with different dosages.
An examination of Figure 4 shows the pattern previously described for the entire group and for the male and female groups independently. In other words, the highest red cell counts decrease and the lowest ones increase under the regime of 1/400 grain. The findings are essentially the same following the administration of 1/800 grain of posterior pituitary extract (Figure 3). The coefficient of correlation for the group receiving 1/400 grain is -.618 with a P value of >.05. The coefficient of correlation for the group receiving 1/800 grain of posterior pituitary extract is -.879 and significant (P <.025).
Table 2–Effect of Posterior Pituitary Extract (Different Doses) Upon the Erythrocyte Count
| patient number | age | sex | dosage | number of days of therapy | initial red cell count | final red cell count | difference in red cell count |
| 476
602 287 274 092 225 122 507 604 500 153 366 292 373 219 341 283 638 663 522 |
69
41 68 58 32 40 — 72 40 32 44 46 40 40 50 49 30 58 46 45 |
F
F F F F F F F F F F F F F F F F F F F |
1/400
1/400 1/400 1/400 1/400 1/400 1/400 1/400 1/400 1/400 1/800 1/800 1/800 1/800 1/800 1/800 1/800 1/800 1/800 1/800 |
3
3 3 4 4 4 7 8 18 13 2 4 4 4 6 6 7 9 11 14 |
4.45
4.40 4.30 4.08 4.30 4.60 5.19 4.73 4.55 5.00 4.65 4.30 4.45 4.70 4.60 5.00 4.25 4.90 4.95 4.00 |
4.44
4.40 4.40 4.30 4.60 4.50 5.10 4.34 4.48 4.95 4.65 4.40 4.41 4.60 4.50 4.65 4.33 4.80 4.85 4.50 |
-.01
.00 +.10 +.22 +.30 -.10 -.09 -.39 -.07 -.05
.00 +.10 -.04 -.10 -.10 -.35 +.08 -.10 -.10 +.50 |
Duration Analysis
Table 3 summarizes the data for a group of ten females subjected to 1/400 grain of posterior pituitary extract for three to four days. Included also in this same chart are the findings from a group of ten females administered 1/400 grain of posterior pituitary extract for five to 27 days. Thus, an opportunity is afforded to study the changes in the red cell count based upon the duration of therapy.
An examination of Figure 5 shows that the red cell counts in the higher brackets decrease while those in the lower groups increase during three to four days with 1/400 grain of posterior pituitary extract. The coefficient of correlation proved to be -.664 with a P >.05. Figure 6 graphically depicts the changes in the red cell count following five to 27 days under the same regime of 1/400 grain of posterior pituitary extract in ten females. A statistical analysis of these data indicates a coefficient of correlation of -.492 and a P >.10.
Table 3–Effect of 1/400 Grain Posterior Pituitary Extract for Different Time Periods Upon the Erythrocyte Count
| patient number | age | sex | number of days of therapy | initial red cell count | final red cell count | difference in red cell count |
| 210
002 393 476 602 287 274 092 236 225 299 336 085 122 088 507 664 500 604 430 |
63
54 65 69 41 68 58 32 36 40 60 72 65 — 21 72 64 32 40 50 |
F
F F F F F F F F F F F F F F F F F F F |
3
3 3 3 3 3 4 4 4 4 5 5 6 7 7 8 9 13 18 27 |
4.65
5.50 4.65 4.45 4.40 4.30 4.08 4.30 4.48 4.60 4.50 4.55 3.95 5.19 4.60 4.73 4.45 5.00 4.55 4.80 |
4.55
5.35 4.40 4.44 4.40 4.40 4.30 4.60 4.45 4.50 4.50 4.65 4.10 5.10 4.62 4.34 4.35 4.95 4.48 4.55 |
-.10
-.15 -.25 -.01 .00 +.10 +.22 +.30 -.03 -.10
.00 +.10 +.15 -.09 +.02 -.39 -.10 -.05 -.07 -.25 |
Discussion
It is rather interesting, from an examination of Tables 1-3 and Figures 1-6, that the relationship between posterior pituitary extract and erythrocyte count is not linear. In other words, this particular hormone does not consistently elevate or reduce the circulating red cell count. Rather, the evidence indicates a relatively narrow physiologic parameter of homeostasis. Apparently, the administration of posterior pituitary extract seems to attempt to right deviations from this very narrow range. Thus, it can be observed that relatively low and high red cell counts increase and decrease respectively. It is particularly pertinent that the changes seem to be very small. Thus, it appears that the erythrocyte count is very sensitive to this particular hormone. Mention should be made that these findings are not in agreement with earlier reports.18,19
A second point worthy of mention is the seemingly different physiologic range or point in the two sexes. More detailed examination of Table 1 and Figures 2 and 3 disclose that the tendency to reach homeostasis in the male is at 5,000,000 circulating red blood cells. In contrast, the hypothetic norm in the female appears to be in the area of 4,500,000.
One point which remains unanswered is whether the changes which have been noted are more significant in one or the other sex, at one or the other dosage, and in those receiving posterior pituitary extract for a relatively short or long period of time, These relationships have been analyzed statistically. The general statement can be made that none of the differences of the means proves to be statistically significant.
Two explanations have been proposed for the effect of posterior pituitary extract upon erythropoiesis. First, the posterior hypophyseal lobe may affect blood destruction possibly by way of the reticuloendothelial system.11 Second, the anemia may be the result of hemodilution and eventual hemolysis due to water retention.16,17 The latter possibility seems more tenable since dehydration prior to pituitrin administration prevents the anemia.17,18
In order to obtain information regarding the possibility of blood changes in parallel with urinary alterations, the female patients were placed into two groups. The first group included those subjects in whom the red blood cell count migrated with posterior pituitary administration toward 4,500,000 per cu. mm. Table 4 summarizes the patients’ case numbers, sex, initial and final erythrocyte counts, and the initial and final specific gravities of morning urine samples. Figure 7 pictorially depicts the specific gravity relationships at the start of the study and following a variable number of days of posterior pituitary extract administration. The coefficient of correlation proved to be -.619 (significant at the five per cent level).
Table 4–Morning Urinary Specific Gravity Before and After Posterior Pituitary Extract in Female Patients in Whom the Erythrocyte Count After Therapy Migrated Up or Down Toward 4,500,000 Per Cu mm.
| patient number | initial red cell count | final red cell count | difference in red cell count | initial specific gravity | final specific gravity | difference in specific gravity |
| 002
225 210 299 122 366 633 274 500 219 085 341 283 522 373 |
5.50
4.60 4.65 4.50 5.19 4.30 4.95 4.08 5.00 4.60 3.95 5.00 4.25 4.00 4.70 |
5.35
4.50 4.55 4.50 5.10 4.40 4.85 4.30 4.95 4.50 4.10 4.65 4.33 4.50 4.60 |
-.15
-.10 -.10 .00 -.09 +.10 -.10 +.22 -.05 -.10 +.15 -.35 +.08 +.50 -.10 |
1.006
1.008 1.012 1.008 1.011 1.018 1.021 1.021 1.005 1.008 1.014 1.011 1.024 1.028 1.022 |
1.019
1.013 1.015 1.009 1.012 1.018 1.020 1.020 1.004 1.006 1.012 1.008 1.021 1.022 1.015 |
+.013
+.005 +.003 +.001 +.001 .000 -.001 -.001 -.001 -.002 -.002 -.003 -.003 -.006 -.007 |
A chart (Table 5) summarizes the information for those subjects with red blood cell counts which did not migrate toward 4,500,000 per cu. mm. These data are graphically represented in Figure 8. The coefficient of correlation was found to be -.595 and not statistically significant (P >.10).
It would, therefore, seem that the hematologic changes observed in this report may be due, in part, to hemodilution and hemoconcentration.
Table 5–Morning Urinary Specific Gravity Before and After Posterior Pituitary Extract in Female Patients in Whom the Erythrocyte Count After Therapy Migrated Away From 4,500.000 Per Cu. mm.
| patient number | initial red cell count | final red cell count | difference in red cell count | initial specific gravity | final specific gravity | difference in specific gravity |
| 236
153 476 664 336 088 602 292 |
4.48
4.65 4.45 4.45 4.55 4.60 4.40 4.45 |
4.45
4.65 4.44 4.35 4.65 4.62 4.40 4.41 |
-.03
.00 -.01 -.10 +.10 +.02 .00 -.04 |
1.008
1.008 1.016 1.003 1.010 1.020 1.013 1.021 |
1.018
1.016 1.019 1.005 1.010 1.018 1.010 1.018 |
+.010
+.008 +.003 +.002 .000 -.002 -.003 -.003 |
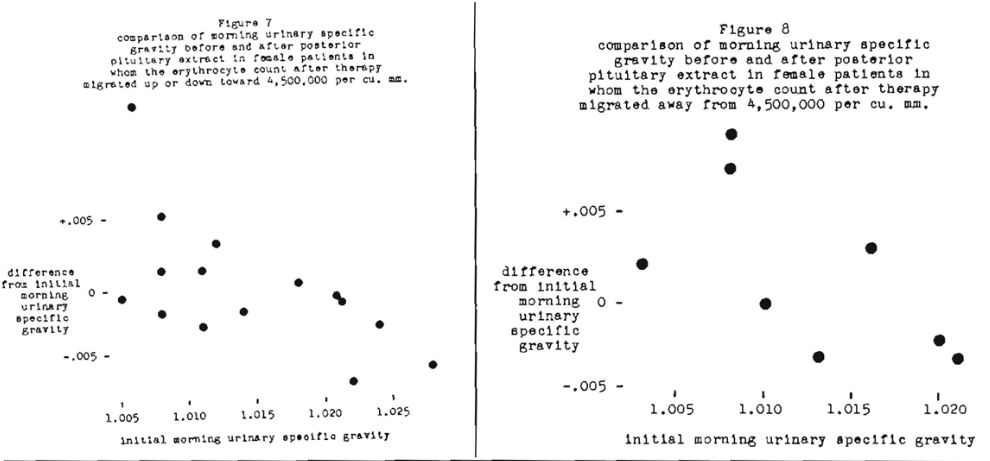
Figure 7 and 8
Summary
- This report describes the effect of small doses (administered daily and orally) of posterior pituitary extract upon the circulating erythrocyte count.
- The evidence suggests that the number of red blood cells decreases and increases toward a homeostatic point or range.
- There is corollary data to indicate that the physiologic erythrocyte count in the two sexes is different; 5,000,000/cu. mm. and 4,500,000/cu. mm. for the male and female respectively.
- The observed changes are not significantly different in the two sexes, in those with small (gr. 1/800) versus relatively large (gr. 1/400) doses, and with difference in duration of therapy (3-4 versus 5-27 days).
- Presumptive evidence is offered to indicate changes in urinary specific gravity in parallel with the alterations in the erythrocyte count.
This study was made possible in part by a grant from The American Society of Anthropometric Medicine and Nutrition. Dr. Page is in private practice. Dr. Ringsdorf and Dr. Cheraskin are staff personnel with the Section on Oral Medicine at the University of Alabama Medical Center in Birmingham.
References Cited:
- Linman, J. W. and Bethell, F. H. “Factors controlling erythropoiesis.” 1960. Springfield, Charles C. Thomas. pp. 10-18.
- Gordon, A. S. and Charipper, H. A. “The endocrine system and hemopoiesis.” Ann. N. Y. Acad. Sc. 48: No. 7, 615-637, July 3, 1947.
- Daughaday, W. H., Williams, R. H. and Daland, G. A. “The effects of endocrinopathies on the blood.” Blood 3, No. 12, 1342-1366, December 1948.
- Gordon, A. S. “Endocrine influences upon the formed elements of blood and blood-forming organs.” Rec. Prog. Hormone Res., 10: 339-394, 1954.
- VanDyke, D. C., Contopoulos, A. N., Williams, B. S., Simpson, M. E., Lawrence, J. H. and Evans, H. M. “Hormonal factors influencing erythropoiesis.” Acta Haemat. 11: No. 4, 203-222, April 1954.
- Crafts, R. C. “Relationships of hormones to the utilization of essential nutrients in erythropoiesis.” Amer Jour. Clin. Nutrit. 3 No. 1, 52-55, January-February 1955.
- Crafts, R. C. “The effects of endocrines on the formed elements of the blood. I. The effects of hypophysectomy, thyroidectomy and adrenalectomy on the blood of the female rat.” Endocrinology, 29: No. 4, 596-605, October 1941.
- Meyer, O. O., Stewart, G. E., Thewlis, E. W. and Rusch, H. P. “The hypophysis and hematopoiesis.” Folia Haemat. 57: No. 1, 99-109, March 1937.
- Meyer, O. O, Thewlis, E. W. and Rusch, H. P. “The hypophysis and hemopoiesis.” Endocrinology, 27: No. 6, 932-944, December 1940.
- Berlin, N. I., VanDyke, D. C. Siri, W. E. and Williams, C P. “The effect of hypophysectomy on the total circulating red cell volume of the rat.” Endocrinology, 47: No. 6, 429-435, December 1950.
- Crafts, R. C. and Meineke, H. A. “Influence of the pituitary on hemopoiesis.” Amer. Jour. CIin. Nutrit. 5: No. 4, 453-460, July-August 1957.
- Crafts, R. C. and Meineke, H. A. “The anemia of hypophysectomized animals.” Ann. N. Y. Acad. Sc. 77: No. 3, 501-517, June 25, 1959.
- Dodds, E. C. and Noble, R. L. “Relation of the posterior lobe of the pituitary gland to anemia and to blood formation.” Nature, 135: No. 3419, 788, May 11, 1935.
- Dodds, E. C., Noble, R. L., Hills, G. M. and Williams, P. C. “The posterior lobe of the pituitary gland: its relationship to the stomach and to the blood picture.” Lancet 1: No. 19, 1099-1100, May 11, 1935.
- McFarlane, W. D. and McPhail, M. K. “Pituitrin injections and the blood picture in the normal and hypophysectomized guinea pig.” Amer. Jour. Med. Sc. 193: No. 3, 385-389, March 1937.
- Gilman, A. and Goodman, L. “Pituitrin anemia.” Jour. Pharm. and Exp. Therapy, 57: No. 2, 123, June 1936.
- Gilman, A. and Goodman, L. “Pituitrin anemia.” Amer. Jour. Physiol. 118: No. 2, 241-250, February 1937.
- Davis, J.E. “The production of experimental polycythemia by the daily administration of epinephrine or posterior pituitary solution.” Amer. Jour. Physiol. 137. No, 4, 699-702. November 1942.
- VanDyke, D. C., Garcia, J. F., Simpson, M. E., Huff, R. L., Contopoulos, A. N. and Evans, H. M. “Maintenance of circulating red cell volume in rats after removal of the posterior and intermediate lobes of the pituitary.” Blood 7: No. 10, 1017-1019, October 1952.
- Page, M. E., Ringsdorf, W. M., Jr. and Cheraskin, E. “Anthropometry and posterior pituitary disease.” (in preparation)
- Page, M. E., Ringsdorf, W. M., Jr. and Cheraskin, E. “The effect of a low-refined-carbohydrate high-protein diet upon nonfasting blood sugar.” Odontologisk Revy 12: No. 1, 1-24, 1961.
- Conn, H. F. Current therapy. 1961. Philadelphia, W. B. Saunders Company. pp. 332-333.
- Page, M. E., Ringsdorf, W. M., Jr. and Cheraskin, E. “Hormones and hemopoiesis. II. Posterior pituitary extract and hemoglobin.” (in preparation).
- Page, M. E., Ringsdorf, W. M., Jr. and Cheraskin, E. “Hormones and hemopoiesis. III. Posterior pituitary extract and hematocrit.” (in preparation).
- Page, M. E., Ringsdorf, W. M., Jr. and Cheraskin, E. “Hormones and hemopoiesis. IV. Posterior pituitary extract and mean corpuscular volume.” (in preparation).
- Page, M. E., Ringsdorf, W. M., Jr. and Cheraskin, E. “Hormones and hemopoiesis. V. Posterior pituitary extract and mean corpuscular hemoglobin.” (in preparation).
- Page, M. E., Ringsdorf, W. M., Jr. and Cheraskin, E. “Hormones and hemopoiesis. VI Posterior pituitary extract and mean corpuscular hemoglobin concentration.” (in preparation).